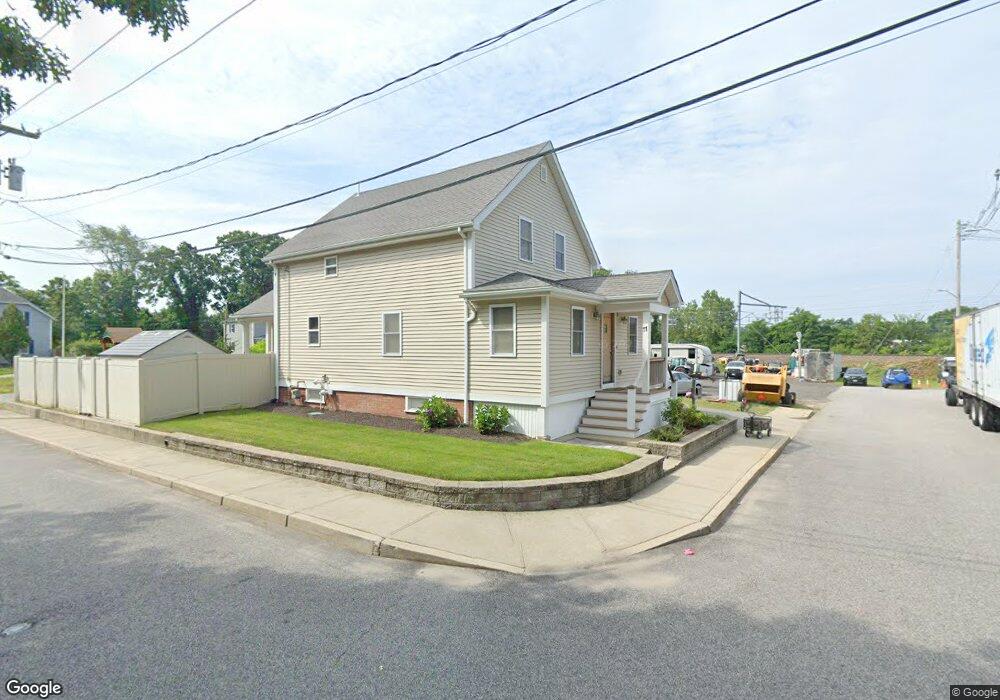
11 Gardner Ave Cranston, RI 02910
Park View NeighborhoodEstimated Value: $364,000 - $392,529
4
Beds
1
Bath
1,075
Sq Ft
$353/Sq Ft
Est. Value
About This Home
This home is located at 11 Gardner Ave, Cranston, RI 02910 and is currently estimated at $379,382, approximately $352 per square foot. 11 Gardner Ave is a home located in Providence County with nearby schools including Edgewood Highland Elementary School, Edward S. Rhodes School, and Park View Middle School.
Ownership History
Date
Name
Owned For
Owner Type
Purchase Details
Closed on
Feb 2, 2009
Sold by
Bober Daiphin and Jones Dorothy
Bought by
Zambarabo Christopher
Current Estimated Value
Home Financials for this Owner
Home Financials are based on the most recent Mortgage that was taken out on this home.
Original Mortgage
$93,076
Outstanding Balance
$59,145
Interest Rate
5.28%
Estimated Equity
$320,237
Create a Home Valuation Report for This Property
The Home Valuation Report is an in-depth analysis detailing your home's value as well as a comparison with similar homes in the area
Home Values in the Area
Average Home Value in this Area
Purchase History
| Date | Buyer | Sale Price | Title Company |
|---|---|---|---|
| Zambarabo Christopher | $35,000 | -- | |
| Zambarane Christopher | $35,000 | -- |
Source: Public Records
Mortgage History
| Date | Status | Borrower | Loan Amount |
|---|---|---|---|
| Open | Zambarane Christopher | $93,076 |
Source: Public Records
Tax History Compared to Growth
Tax History
| Year | Tax Paid | Tax Assessment Tax Assessment Total Assessment is a certain percentage of the fair market value that is determined by local assessors to be the total taxable value of land and additions on the property. | Land | Improvement |
|---|---|---|---|---|
| 2025 | $4,047 | $291,600 | $88,300 | $203,300 |
| 2024 | $3,969 | $291,600 | $88,300 | $203,300 |
| 2023 | $3,765 | $199,200 | $60,900 | $138,300 |
| 2022 | $3,687 | $199,200 | $60,900 | $138,300 |
| 2021 | $3,586 | $199,200 | $60,900 | $138,300 |
| 2020 | $3,257 | $156,800 | $47,400 | $109,400 |
| 2019 | $3,257 | $156,800 | $47,400 | $109,400 |
| 2018 | $3,181 | $156,800 | $47,400 | $109,400 |
| 2017 | $2,863 | $124,800 | $37,200 | $87,600 |
| 2016 | $2,802 | $124,800 | $37,200 | $87,600 |
| 2015 | $2,802 | $124,800 | $37,200 | $87,600 |
| 2014 | $2,677 | $117,200 | $37,200 | $80,000 |
Source: Public Records
Map
Nearby Homes