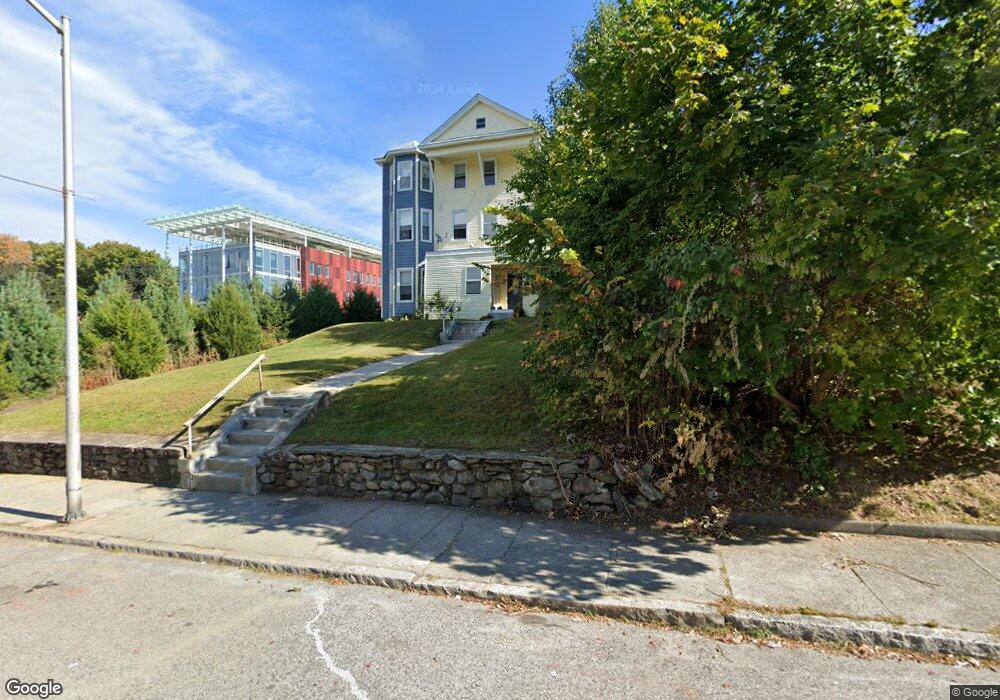
11 Gates St Worcester, MA 01610
Beacon Brightly NeighborhoodEstimated Value: $777,000 - $927,000
12
Beds
3
Baths
4,049
Sq Ft
$207/Sq Ft
Est. Value
About This Home
This home is located at 11 Gates St, Worcester, MA 01610 and is currently estimated at $838,667, approximately $207 per square foot. 11 Gates St is a home located in Worcester County with nearby schools including Goddard School of Science & Technology, Jacob Hiatt Magnet School, and Chandler Magnet.
Ownership History
Date
Name
Owned For
Owner Type
Purchase Details
Closed on
Mar 17, 2010
Sold by
Baning Eric and Baning Abenaa
Bought by
Scribner Dev Llc
Current Estimated Value
Purchase Details
Closed on
Jul 31, 2002
Sold by
Truong Julie T
Bought by
Baning Abenaa and Baning Eric
Purchase Details
Closed on
May 29, 2002
Sold by
Vando Chau B
Bought by
Truong Julie T
Purchase Details
Closed on
Aug 31, 2001
Sold by
Bui Quan and Le Hiep
Bought by
Vando Chau Bao
Purchase Details
Closed on
Oct 19, 2000
Sold by
5Mc2 Rt 1996
Bought by
Bui Quan
Purchase Details
Closed on
Dec 10, 1992
Sold by
Federal Home Loan Mortgage Corporation
Bought by
Carcieri Susan M
Purchase Details
Closed on
Aug 12, 1992
Sold by
Morrow Josephine
Bought by
Federal National Mortgage Association
Create a Home Valuation Report for This Property
The Home Valuation Report is an in-depth analysis detailing your home's value as well as a comparison with similar homes in the area
Home Values in the Area
Average Home Value in this Area
Purchase History
| Date | Buyer | Sale Price | Title Company |
|---|---|---|---|
| Scribner Dev Llc | $112,000 | -- | |
| Baning Abenaa | $199,000 | -- | |
| Truong Julie T | $160,000 | -- | |
| Vando Chau Bao | $140,000 | -- | |
| Bui Quan | $97,000 | -- | |
| Carcieri Susan M | $15,000 | -- | |
| Federal National Mortgage Association | $131,902 | -- |
Source: Public Records
Mortgage History
| Date | Status | Borrower | Loan Amount |
|---|---|---|---|
| Open | Federal National Mortgage Association | $150,750 | |
| Previous Owner | Federal National Mortgage Association | $257,000 |
Source: Public Records
Tax History
| Year | Tax Paid | Tax Assessment Tax Assessment Total Assessment is a certain percentage of the fair market value that is determined by local assessors to be the total taxable value of land and additions on the property. | Land | Improvement |
|---|---|---|---|---|
| 2025 | $9,209 | $698,200 | $65,300 | $632,900 |
| 2024 | $8,421 | $612,400 | $65,300 | $547,100 |
| 2023 | $8,020 | $559,300 | $51,600 | $507,700 |
| 2022 | $6,991 | $459,600 | $41,300 | $418,300 |
| 2021 | $6,221 | $382,100 | $33,000 | $349,100 |
| 2020 | $5,704 | $335,500 | $33,000 | $302,500 |
| 2019 | $5,119 | $284,400 | $31,500 | $252,900 |
| 2018 | $4,977 | $263,200 | $31,500 | $231,700 |
| 2017 | $4,640 | $241,400 | $31,500 | $209,900 |
| 2016 | $4,468 | $216,800 | $21,800 | $195,000 |
| 2015 | $4,351 | $216,800 | $21,800 | $195,000 |
| 2014 | $4,236 | $216,800 | $21,800 | $195,000 |
Source: Public Records
Map
Nearby Homes
- 13-15 Gates St
- 6 Cristy St
- 4 Cristy St
- 7 Gates St
- 7 Gates St Unit U3
- 4 Gates St
- 4 Gates St
- 4 Gates St
- 23 Gates St
- 23 Gates St Unit 3
- 7 Cristy St
- 7 Cristy St Unit Cristy 1st FL UNIT 3
- 7 Cristy St Unit 3 CRISTY ST UNIT 1
- 7 Cristy St Unit Cristy 1st FL
- 5 Cristy St
- 27 Gates St
- 20 Gates St
- 57 Cristy St
- 3 Cristy St
- 31 Gates St
Your Personal Tour Guide
Ask me questions while you tour the home.