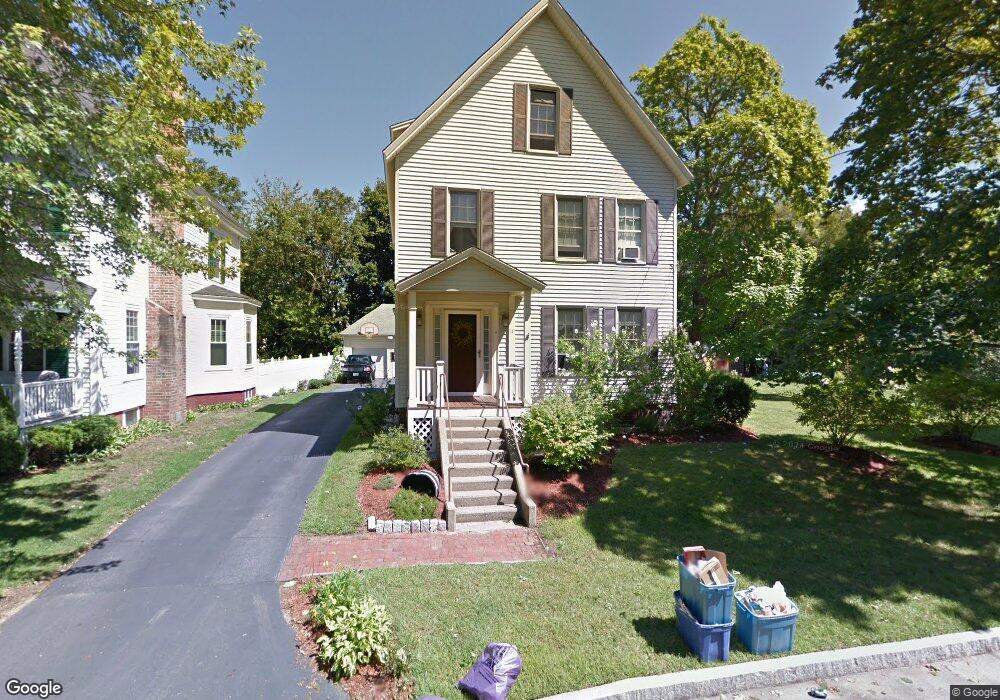
11 Harvard St Concord, NH 03301
South End NeighborhoodEstimated Value: $549,000 - $617,612
3
Beds
2
Baths
2,355
Sq Ft
$246/Sq Ft
Est. Value
About This Home
This home is located at 11 Harvard St, Concord, NH 03301 and is currently estimated at $579,153, approximately $245 per square foot. 11 Harvard St is a home located in Merrimack County with nearby schools including Abbot-Downing School, Rundlett Middle School, and Concord High School.
Ownership History
Date
Name
Owned For
Owner Type
Purchase Details
Closed on
Jul 31, 1998
Sold by
Tewksbury Dennis L and Tewksbury Nancy H
Bought by
Woodfin Richard S and Woodfin Kathryn M
Current Estimated Value
Home Financials for this Owner
Home Financials are based on the most recent Mortgage that was taken out on this home.
Original Mortgage
$122,500
Interest Rate
6.92%
Mortgage Type
Purchase Money Mortgage
Create a Home Valuation Report for This Property
The Home Valuation Report is an in-depth analysis detailing your home's value as well as a comparison with similar homes in the area
Home Values in the Area
Average Home Value in this Area
Purchase History
| Date | Buyer | Sale Price | Title Company |
|---|---|---|---|
| Woodfin Richard S | $129,000 | -- |
Source: Public Records
Mortgage History
| Date | Status | Borrower | Loan Amount |
|---|---|---|---|
| Open | Woodfin Richard S | $235,000 | |
| Closed | Woodfin Richard S | $35,000 | |
| Closed | Woodfin Richard S | $122,500 |
Source: Public Records
Tax History
| Year | Tax Paid | Tax Assessment Tax Assessment Total Assessment is a certain percentage of the fair market value that is determined by local assessors to be the total taxable value of land and additions on the property. | Land | Improvement |
|---|---|---|---|---|
| 2025 | $11,298 | $388,100 | $126,200 | $261,900 |
| 2024 | $10,874 | $392,700 | $126,200 | $266,500 |
| 2023 | $10,548 | $392,700 | $126,200 | $266,500 |
| 2022 | $10,167 | $392,700 | $126,200 | $266,500 |
| 2021 | $9,865 | $392,700 | $126,200 | $266,500 |
| 2020 | $9,668 | $361,300 | $99,400 | $261,900 |
| 2019 | $9,251 | $333,000 | $103,200 | $229,800 |
| 2018 | $9,018 | $319,900 | $103,600 | $216,300 |
| 2017 | $8,630 | $305,600 | $103,600 | $202,000 |
| 2016 | $8,201 | $296,400 | $101,700 | $194,700 |
| 2015 | $7,289 | $266,600 | $92,000 | $174,600 |
| 2014 | $7,148 | $266,600 | $92,000 | $174,600 |
| 2013 | $6,820 | $266,600 | $92,000 | $174,600 |
| 2012 | $6,646 | $272,700 | $92,000 | $180,700 |
Source: Public Records
Map
Nearby Homes
- 20 Carter St
- 47 South St
- 0 South St Unit 4969509
- 1 Matthew St Unit 6
- 58 S State St
- 5 Broad Ave
- 289 South St
- 24 Hazel Dr
- 55 Tremont St
- 30 Longmeadow Dr
- 7 Highridge Trail
- 22 Fairfield Dr
- 157 Rumford St
- 19 Grappone Dr
- 30 Penacook St
- 28 Stevens Dr
- 107 Garvins Falls Rd
- 20 Grandview Rd
- 5 Ormond St
- 128 Loudon Rd Unit 12F
Your Personal Tour Guide
Ask me questions while you tour the home.