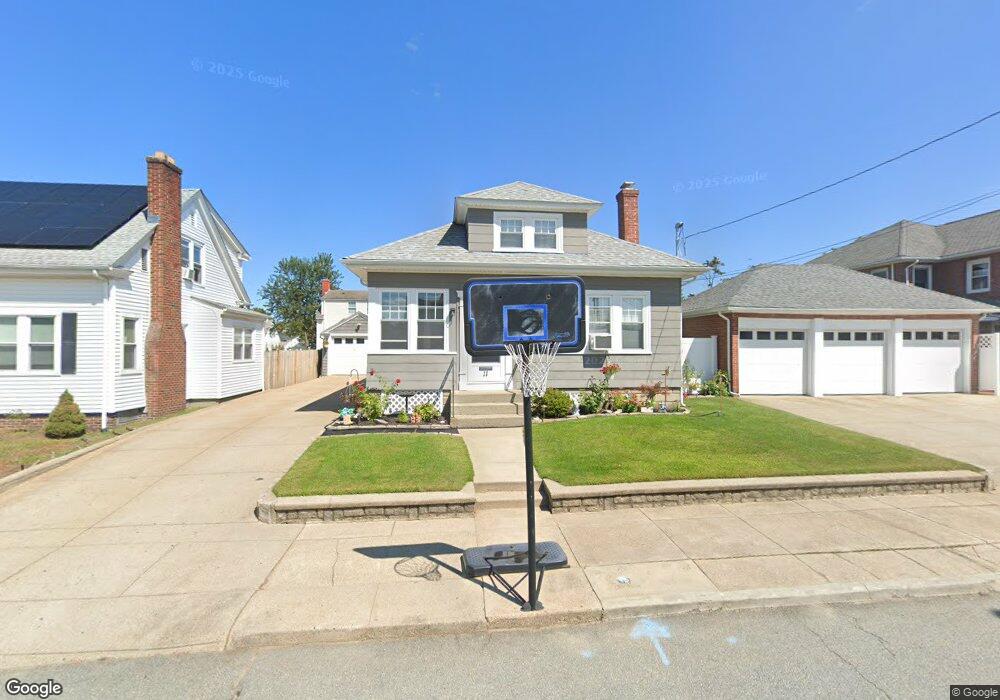
11 Hemalin Rd Cranston, RI 02910
Forest Hills NeighborhoodEstimated Value: $366,000 - $424,000
2
Beds
1
Bath
1,024
Sq Ft
$376/Sq Ft
Est. Value
About This Home
This home is located at 11 Hemalin Rd, Cranston, RI 02910 and is currently estimated at $384,985, approximately $375 per square foot. 11 Hemalin Rd is a home located in Providence County with nearby schools including Woodridge Elementary School, Western Hills Middle School, and Cranston High School West.
Ownership History
Date
Name
Owned For
Owner Type
Purchase Details
Closed on
Dec 29, 2021
Sold by
Tetreault John B
Bought by
Tetreault John B and Peck Natalee
Current Estimated Value
Home Financials for this Owner
Home Financials are based on the most recent Mortgage that was taken out on this home.
Original Mortgage
$155,000
Outstanding Balance
$130,661
Interest Rate
3.11%
Mortgage Type
New Conventional
Estimated Equity
$254,324
Purchase Details
Closed on
Apr 28, 1995
Sold by
Papa Diane J
Bought by
Tetreault John B
Create a Home Valuation Report for This Property
The Home Valuation Report is an in-depth analysis detailing your home's value as well as a comparison with similar homes in the area
Home Values in the Area
Average Home Value in this Area
Purchase History
| Date | Buyer | Sale Price | Title Company |
|---|---|---|---|
| Tetreault John B | -- | None Available | |
| Tetreault John B | -- | None Available | |
| Tetreault John B | $95,000 | -- | |
| Tetreault John B | $95,000 | -- |
Source: Public Records
Mortgage History
| Date | Status | Borrower | Loan Amount |
|---|---|---|---|
| Open | Tetreault John B | $155,000 | |
| Closed | Tetreault John B | $155,000 | |
| Previous Owner | Tetreault John B | $132,000 | |
| Previous Owner | Tetreault John B | $137,000 |
Source: Public Records
Tax History
| Year | Tax Paid | Tax Assessment Tax Assessment Total Assessment is a certain percentage of the fair market value that is determined by local assessors to be the total taxable value of land and additions on the property. | Land | Improvement |
|---|---|---|---|---|
| 2025 | $3,997 | $288,000 | $100,500 | $187,500 |
| 2024 | $3,920 | $288,000 | $100,500 | $187,500 |
| 2023 | $3,663 | $193,800 | $69,300 | $124,500 |
| 2022 | $3,587 | $193,800 | $69,300 | $124,500 |
| 2021 | $3,488 | $193,800 | $69,300 | $124,500 |
| 2020 | $3,535 | $170,200 | $72,600 | $97,600 |
| 2019 | $3,535 | $170,200 | $72,600 | $97,600 |
| 2018 | $3,332 | $164,200 | $72,600 | $91,600 |
| 2017 | $3,159 | $137,700 | $66,000 | $71,700 |
| 2016 | $3,091 | $137,700 | $66,000 | $71,700 |
| 2015 | $3,091 | $137,700 | $66,000 | $71,700 |
| 2014 | $3,088 | $135,200 | $66,000 | $69,200 |
Source: Public Records
Map
Nearby Homes
Your Personal Tour Guide
Ask me questions while you tour the home.