Estimated Value: $1,372,315 - $1,758,000
4
Beds
3
Baths
3,551
Sq Ft
$435/Sq Ft
Est. Value
About This Home
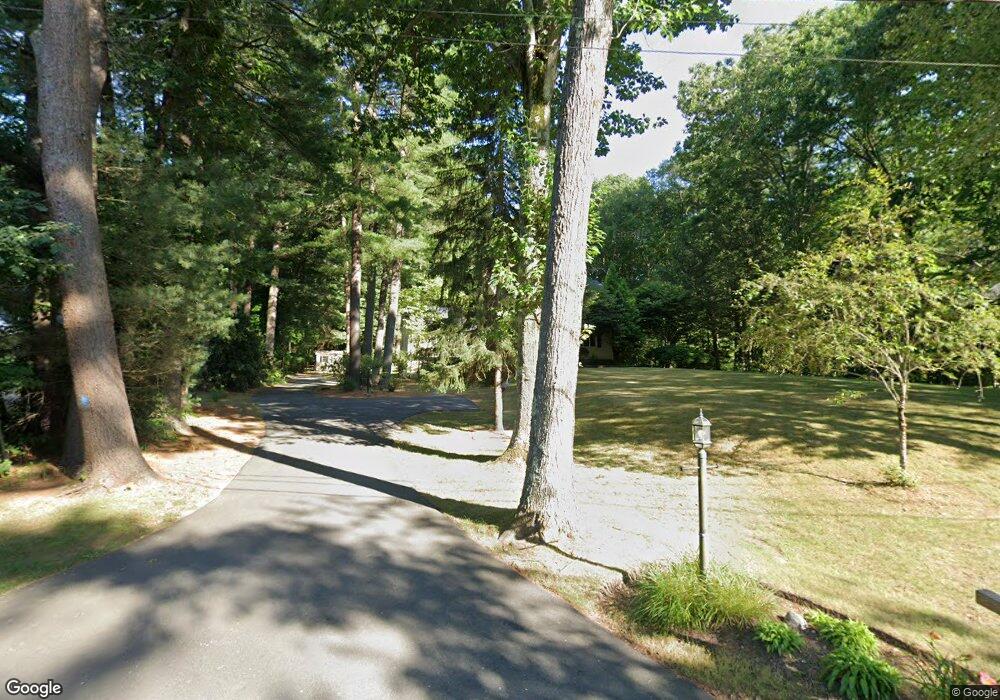
This home is located at 11 Juniper Ln, Dover, MA 02030 and is currently estimated at $1,545,829, approximately $435 per square foot. 11 Juniper Ln is a home located in Norfolk County with nearby schools including Chickering Elementary School, Dover-Sherborn Regional Middle School, and Dover-Sherborn Regional High School.
Ownership History
Date
Name
Owned For
Owner Type
Purchase Details
Closed on
Aug 3, 1990
Sold by
Assefi Touraj
Bought by
Stone Richard M
Current Estimated Value
Home Financials for this Owner
Home Financials are based on the most recent Mortgage that was taken out on this home.
Original Mortgage
$300,000
Interest Rate
10.02%
Mortgage Type
Purchase Money Mortgage
Purchase Details
Closed on
Jun 20, 1988
Sold by
Geller Andrew L
Bought by
Assefi Touraj
Home Financials for this Owner
Home Financials are based on the most recent Mortgage that was taken out on this home.
Original Mortgage
$168,700
Interest Rate
10.24%
Mortgage Type
Purchase Money Mortgage
Purchase Details
Closed on
Mar 4, 1988
Sold by
Bornstein Robert Z
Bought by
Geller Andrew L
Home Financials for this Owner
Home Financials are based on the most recent Mortgage that was taken out on this home.
Original Mortgage
$168,700
Interest Rate
10.35%
Mortgage Type
Purchase Money Mortgage
Create a Home Valuation Report for This Property
The Home Valuation Report is an in-depth analysis detailing your home's value as well as a comparison with similar homes in the area
Home Values in the Area
Average Home Value in this Area
Purchase History
| Date | Buyer | Sale Price | Title Company |
|---|---|---|---|
| Stone Richard M | $385,000 | -- | |
| Assefi Touraj | $440,000 | -- | |
| Geller Andrew L | $422,500 | -- |
Source: Public Records
Mortgage History
| Date | Status | Borrower | Loan Amount |
|---|---|---|---|
| Closed | Geller Andrew L | $350,050 | |
| Closed | Geller Andrew L | $300,000 | |
| Previous Owner | Geller Andrew L | $168,700 | |
| Previous Owner | Geller Andrew L | $168,700 |
Source: Public Records
Tax History
| Year | Tax Paid | Tax Assessment Tax Assessment Total Assessment is a certain percentage of the fair market value that is determined by local assessors to be the total taxable value of land and additions on the property. | Land | Improvement |
|---|---|---|---|---|
| 2025 | $12,542 | $1,112,900 | $646,400 | $466,500 |
| 2024 | $11,613 | $1,059,600 | $624,600 | $435,000 |
| 2023 | $11,262 | $923,900 | $548,000 | $375,900 |
| 2022 | $10,614 | $854,600 | $526,200 | $328,400 |
| 2021 | $10,852 | $841,900 | $526,200 | $315,700 |
| 2020 | $10,810 | $841,900 | $526,200 | $315,700 |
| 2019 | $10,886 | $841,900 | $526,200 | $315,700 |
| 2018 | $10,647 | $829,200 | $526,200 | $303,000 |
| 2017 | $10,381 | $795,500 | $482,700 | $312,800 |
| 2016 | $10,246 | $795,500 | $482,700 | $312,800 |
| 2015 | $9,798 | $771,500 | $458,700 | $312,800 |
Source: Public Records
Map
Nearby Homes
- 62 Claybrook Rd
- 60 Claybrook Rd
- 1 Old Colony Dr
- 52 Willow St
- 1780 Central Ave
- 365 Charles River St
- 24 Moseley Ave
- 68 Locust Ln
- 34 Stratford Rd
- 1 Mill St
- 8 Crestview Rd
- 25 Bretton Rd
- 37 Carleton Dr
- 389 Grove St
- 182 Winding River Rd
- 9 Buttercup Ln
- 8 Warren Rd
- 104 Glen St
- 189 Bridle Trail Rd
- 121 Livingston Rd
Your Personal Tour Guide
Ask me questions while you tour the home.