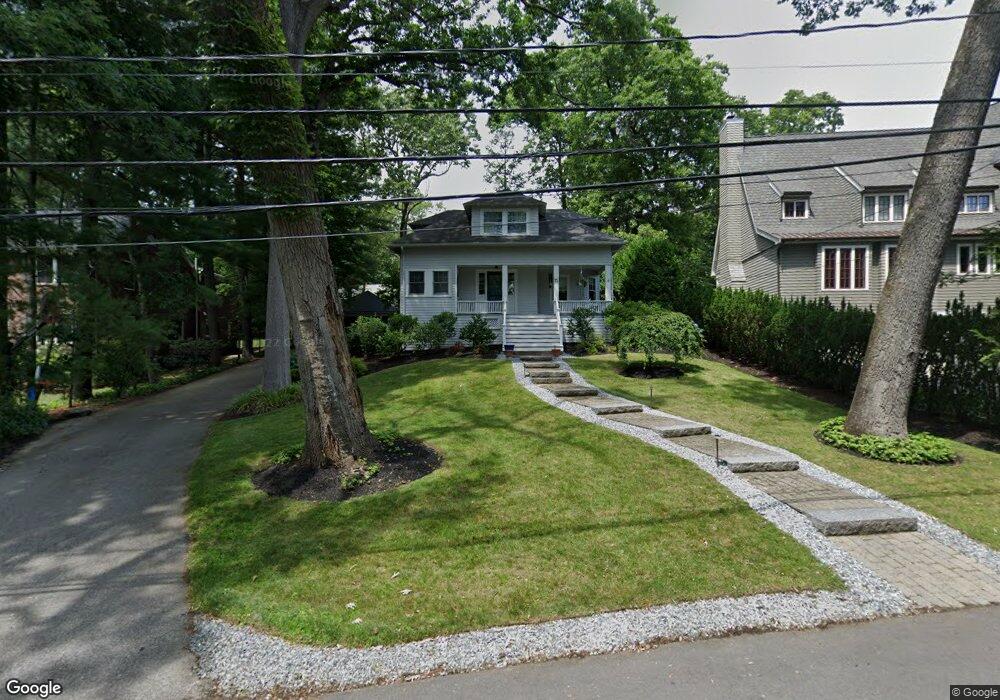
11 Kewadin Rd Waban, MA 02468
Waban NeighborhoodEstimated Value: $1,926,000 - $1,999,000
5
Beds
4
Baths
2,334
Sq Ft
$841/Sq Ft
Est. Value
About This Home
This home is located at 11 Kewadin Rd, Waban, MA 02468 and is currently estimated at $1,962,548, approximately $840 per square foot. 11 Kewadin Rd is a home located in Middlesex County with nearby schools including Angier Elementary School, Charles E Brown Middle School, and Newton South High School.
Ownership History
Date
Name
Owned For
Owner Type
Purchase Details
Closed on
Nov 28, 1990
Sold by
Denk James R
Bought by
Mory Jonathan S
Current Estimated Value
Home Financials for this Owner
Home Financials are based on the most recent Mortgage that was taken out on this home.
Original Mortgage
$262,400
Interest Rate
10.16%
Mortgage Type
Purchase Money Mortgage
Create a Home Valuation Report for This Property
The Home Valuation Report is an in-depth analysis detailing your home's value as well as a comparison with similar homes in the area
Home Values in the Area
Average Home Value in this Area
Purchase History
| Date | Buyer | Sale Price | Title Company |
|---|---|---|---|
| Mory Jonathan S | $328,000 | -- |
Source: Public Records
Mortgage History
| Date | Status | Borrower | Loan Amount |
|---|---|---|---|
| Open | Mory Jonathan S | $200,000 | |
| Closed | Mory Jonathan S | $247,000 | |
| Closed | Mory Jonathan S | $259,200 | |
| Closed | Mory Jonathan S | $262,400 |
Source: Public Records
Tax History Compared to Growth
Tax History
| Year | Tax Paid | Tax Assessment Tax Assessment Total Assessment is a certain percentage of the fair market value that is determined by local assessors to be the total taxable value of land and additions on the property. | Land | Improvement |
|---|---|---|---|---|
| 2025 | $16,341 | $1,667,400 | $1,371,100 | $296,300 |
| 2024 | $15,799 | $1,618,800 | $1,331,200 | $287,600 |
| 2023 | $15,034 | $1,476,800 | $1,033,000 | $443,800 |
| 2022 | $14,385 | $1,367,400 | $956,500 | $410,900 |
| 2021 | $13,880 | $1,290,000 | $902,400 | $387,600 |
| 2020 | $13,468 | $1,290,000 | $902,400 | $387,600 |
| 2019 | $13,088 | $1,252,400 | $876,100 | $376,300 |
| 2018 | $12,488 | $1,154,200 | $793,500 | $360,700 |
| 2017 | $12,109 | $1,088,900 | $748,600 | $340,300 |
| 2016 | $11,581 | $1,017,700 | $699,600 | $318,100 |
| 2015 | $11,042 | $951,100 | $653,800 | $297,300 |
Source: Public Records
Map
Nearby Homes
- 120 Collins Rd
- 873 Chestnut St
- 18 Annawan Rd
- 131 Oliver Rd
- 120 Stanley Rd
- 34 Pilgrim Rd
- 20 Kinmonth Rd Unit 203
- 20 Kinmonth Rd Unit 306
- 80 Pine Ridge Rd
- 989 Chestnut St Unit 8
- 992 Chestnut St
- 29 Montclair Rd
- 1003 Chestnut St
- 1801 Beacon St
- 115 Windsor Rd
- 181 Saint Mary St
- 187 Saint Mary St
- 66 Rockland Place
- 1430 Beacon St
- 103 Thurston Rd