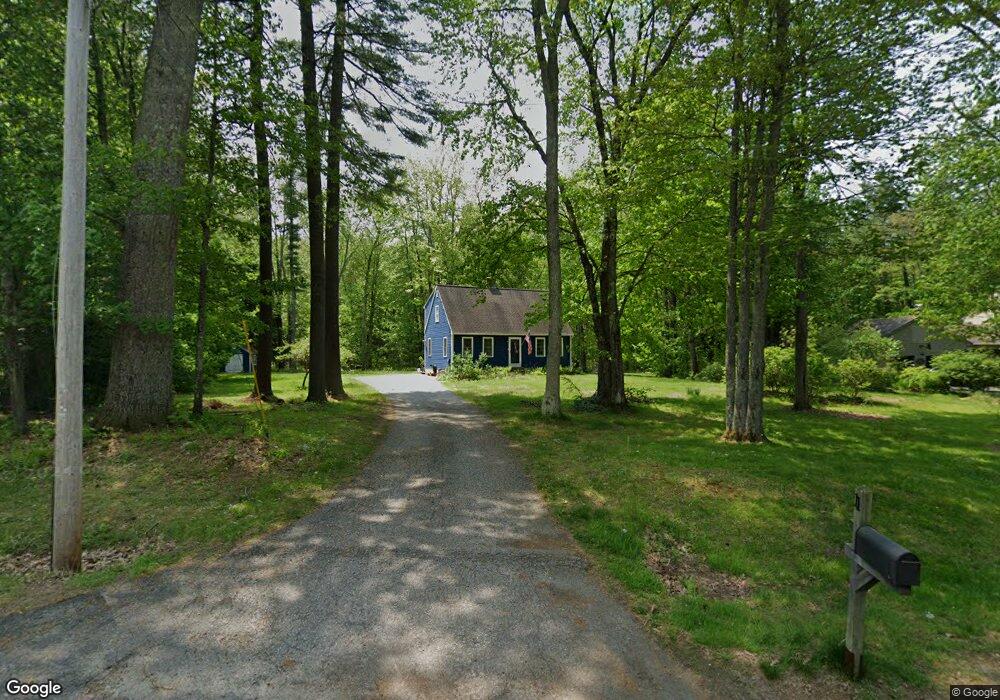
11 Laurel Ln Somersworth, NH 03878
Estimated Value: $443,000 - $526,000
3
Beds
2
Baths
1,444
Sq Ft
$343/Sq Ft
Est. Value
About This Home
This home is located at 11 Laurel Ln, Somersworth, NH 03878 and is currently estimated at $494,793, approximately $342 per square foot. 11 Laurel Ln is a home located in Strafford County with nearby schools including Maple Wood Elementary School, Somersworth High School, and Tri-City Christian Academy.
Ownership History
Date
Name
Owned For
Owner Type
Purchase Details
Closed on
Nov 2, 2009
Sold by
Us Bank Na Tr
Bought by
Devaney Thomas M
Current Estimated Value
Home Financials for this Owner
Home Financials are based on the most recent Mortgage that was taken out on this home.
Original Mortgage
$138,000
Outstanding Balance
$90,385
Interest Rate
5.06%
Estimated Equity
$404,408
Purchase Details
Closed on
Sep 15, 2009
Sold by
Jeffers Mark A
Bought by
Hsbc Bank Usa Tr
Home Financials for this Owner
Home Financials are based on the most recent Mortgage that was taken out on this home.
Original Mortgage
$138,000
Outstanding Balance
$90,385
Interest Rate
5.06%
Estimated Equity
$404,408
Purchase Details
Closed on
Jun 30, 1997
Sold by
Demo Steven P and Demo Kimberly J
Bought by
Rea Ii Lawrence A
Home Financials for this Owner
Home Financials are based on the most recent Mortgage that was taken out on this home.
Original Mortgage
$121,200
Interest Rate
7.81%
Create a Home Valuation Report for This Property
The Home Valuation Report is an in-depth analysis detailing your home's value as well as a comparison with similar homes in the area
Home Values in the Area
Average Home Value in this Area
Purchase History
| Date | Buyer | Sale Price | Title Company |
|---|---|---|---|
| Devaney Thomas M | $172,500 | -- | |
| Hsbc Bank Usa Tr | $162,300 | -- | |
| Rea Ii Lawrence A | $118,000 | -- |
Source: Public Records
Mortgage History
| Date | Status | Borrower | Loan Amount |
|---|---|---|---|
| Open | Rea Ii Lawrence A | $138,000 | |
| Previous Owner | Rea Ii Lawrence A | $121,200 |
Source: Public Records
Tax History Compared to Growth
Tax History
| Year | Tax Paid | Tax Assessment Tax Assessment Total Assessment is a certain percentage of the fair market value that is determined by local assessors to be the total taxable value of land and additions on the property. | Land | Improvement |
|---|---|---|---|---|
| 2024 | $8,896 | $475,700 | $164,100 | $311,600 |
| 2023 | $7,595 | $259,200 | $63,500 | $195,700 |
| 2022 | $7,281 | $259,200 | $63,500 | $195,700 |
| 2021 | $7,136 | $259,200 | $63,500 | $195,700 |
| 2020 | $7,219 | $259,200 | $63,500 | $195,700 |
| 2019 | $7,071 | $259,200 | $63,500 | $195,700 |
| 2018 | $7,043 | $210,800 | $71,800 | $139,000 |
| 2017 | $6,975 | $210,800 | $71,800 | $139,000 |
| 2016 | $6,768 | $210,700 | $71,800 | $138,900 |
| 2015 | $6,795 | $210,700 | $71,800 | $138,900 |
| 2014 | $6,561 | $210,700 | $71,800 | $138,900 |
Source: Public Records
Map
Nearby Homes
- 14 Cherokee St
- 187 Old Rochester Rd
- 38 Laurel Ln
- 92 Old Rochester Rd
- 14 Dudley Ct
- 3 Dudley Ct
- 12 Carriage Hill Ln
- 301 Sherwood Glen
- 200 Sherwood Glen
- 229 Sherwood Glen
- 206 Sherwood Glen
- 203 New Hampshire 108
- 231 Long Hill Rd
- 15 Evergreen Valley Dr
- 13 Sullivan Dr
- 5 Charlotte Dr
- 0 Indian Brook Rd Unit C
- 13 Guy St
- 24 Wildcat Dr
- 18 Lenox Dr Unit C