11 Leroy St Lowell, MA 01851
Lower Highlands NeighborhoodEstimated Value: $490,000 - $619,000
3
Beds
3
Baths
1,690
Sq Ft
$319/Sq Ft
Est. Value
About This Home
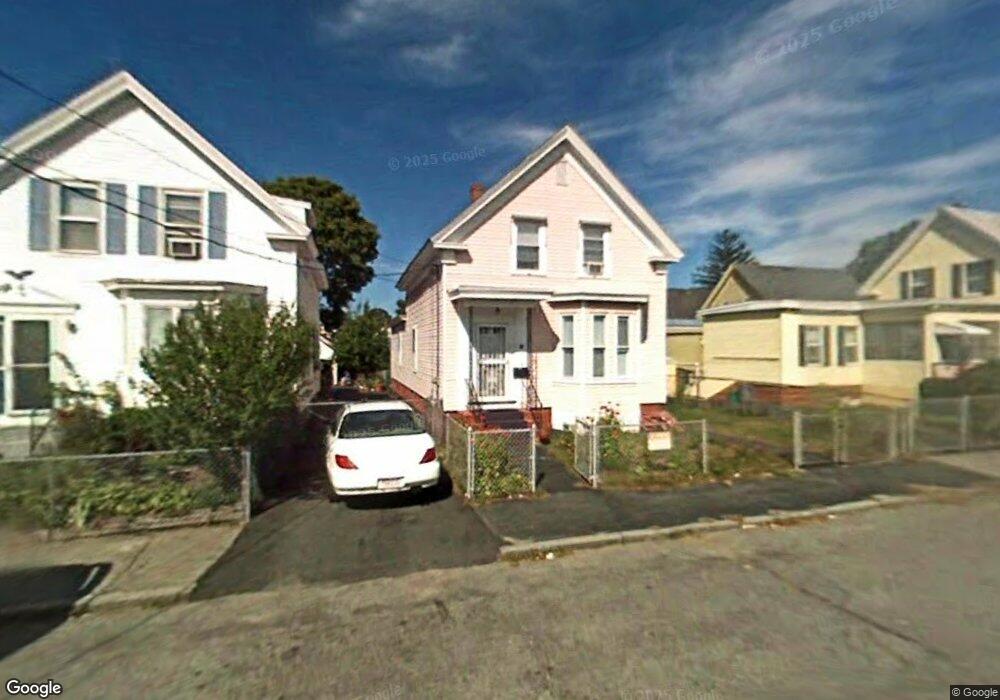
This home is located at 11 Leroy St, Lowell, MA 01851 and is currently estimated at $539,805, approximately $319 per square foot. 11 Leroy St is a home located in Middlesex County with nearby schools including Charles W. Morey Elementary School, Abraham Lincoln Elementary School, and Charlotte M. Murkland Elementary School.
Ownership History
Date
Name
Owned For
Owner Type
Purchase Details
Closed on
Oct 23, 2008
Sold by
Thach Sathi Thi
Bought by
Tremblay John K
Current Estimated Value
Purchase Details
Closed on
Oct 1, 2008
Sold by
Thach Sathi Thi and Sok Sakhoeun
Bought by
Thach Sathi Thi
Purchase Details
Closed on
Sep 5, 2007
Sold by
Estright Marie B Est and Sternby
Bought by
Sok Sakhoeun and Thach Sathi Thi
Create a Home Valuation Report for This Property
The Home Valuation Report is an in-depth analysis detailing your home's value as well as a comparison with similar homes in the area
Home Values in the Area
Average Home Value in this Area
Purchase History
| Date | Buyer | Sale Price | Title Company |
|---|---|---|---|
| Tremblay John K | $203,000 | -- | |
| Tremblay John K | $203,000 | -- | |
| Thach Sathi Thi | -- | -- | |
| Thach Sathi Thi | -- | -- | |
| Sok Sakhoeun | $199,900 | -- | |
| Sok Sakhoeun | $199,900 | -- |
Source: Public Records
Mortgage History
| Date | Status | Borrower | Loan Amount |
|---|---|---|---|
| Closed | Sok Sakhoeun | $20,000 | |
| Open | Sok Sakhoeun | $152,000 | |
| Closed | Sok Sakhoeun | $5,000 |
Source: Public Records
Tax History Compared to Growth
Tax History
| Year | Tax Paid | Tax Assessment Tax Assessment Total Assessment is a certain percentage of the fair market value that is determined by local assessors to be the total taxable value of land and additions on the property. | Land | Improvement |
|---|---|---|---|---|
| 2025 | $5,329 | $464,200 | $143,200 | $321,000 |
| 2024 | $5,144 | $431,900 | $128,800 | $303,100 |
| 2023 | $4,885 | $393,300 | $112,000 | $281,300 |
| 2022 | $4,622 | $364,200 | $101,900 | $262,300 |
| 2021 | $4,348 | $323,000 | $88,600 | $234,400 |
| 2020 | $4,032 | $301,800 | $77,400 | $224,400 |
| 2019 | $3,795 | $270,300 | $71,700 | $198,600 |
| 2018 | $3,687 | $256,200 | $65,200 | $191,000 |
| 2017 | $3,576 | $239,700 | $59,300 | $180,400 |
| 2016 | $3,387 | $223,400 | $56,500 | $166,900 |
| 2015 | $2,703 | $174,600 | $57,800 | $116,800 |
| 2013 | $2,435 | $162,200 | $69,100 | $93,100 |
Source: Public Records
Map
Nearby Homes