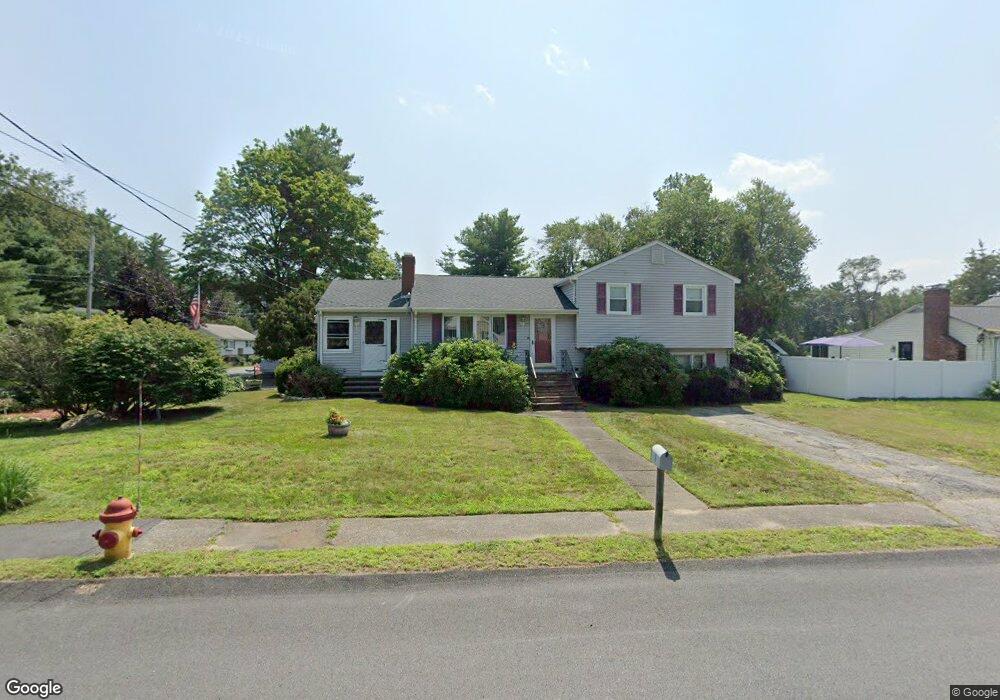
11 Lisa St Burlington, MA 01803
North Burlington NeighborhoodEstimated Value: $841,000 - $925,000
3
Beds
2
Baths
2,004
Sq Ft
$432/Sq Ft
Est. Value
About This Home
This home is located at 11 Lisa St, Burlington, MA 01803 and is currently estimated at $866,163, approximately $432 per square foot. 11 Lisa St is a home located in Middlesex County with nearby schools including Burlington High School, Fox Hill, and Marshall Simonds Middle School.
Ownership History
Date
Name
Owned For
Owner Type
Purchase Details
Closed on
Oct 14, 2025
Sold by
Amelia M Harrington Irt and Callahan
Bought by
Costa Sean
Current Estimated Value
Home Financials for this Owner
Home Financials are based on the most recent Mortgage that was taken out on this home.
Original Mortgage
$550,000
Outstanding Balance
$549,503
Interest Rate
6.5%
Mortgage Type
New Conventional
Estimated Equity
$316,660
Purchase Details
Closed on
Sep 3, 2014
Sold by
Harrington Amelia M
Bought by
Amelia M Harrington Ir M and Amelia Harrington
Purchase Details
Closed on
Oct 1, 2008
Sold by
Harrington Amelia M and Harrington James R
Bought by
Harrington Amelia M
Create a Home Valuation Report for This Property
The Home Valuation Report is an in-depth analysis detailing your home's value as well as a comparison with similar homes in the area
Home Values in the Area
Average Home Value in this Area
Purchase History
| Date | Buyer | Sale Price | Title Company |
|---|---|---|---|
| Costa Sean | $705,000 | -- | |
| Amelia M Harrington Ir M | -- | -- | |
| Amelia M Harrington Ir M | -- | -- | |
| Harrington Amelia M | -- | -- | |
| Harrington Amelia M | -- | -- |
Source: Public Records
Mortgage History
| Date | Status | Borrower | Loan Amount |
|---|---|---|---|
| Open | Costa Sean | $550,000 | |
| Previous Owner | Harrington Amelia M | $100,000 |
Source: Public Records
Tax History Compared to Growth
Tax History
| Year | Tax Paid | Tax Assessment Tax Assessment Total Assessment is a certain percentage of the fair market value that is determined by local assessors to be the total taxable value of land and additions on the property. | Land | Improvement |
|---|---|---|---|---|
| 2025 | $6,158 | $711,100 | $425,000 | $286,100 |
| 2024 | $5,994 | $670,500 | $403,000 | $267,500 |
| 2023 | $5,758 | $612,500 | $350,000 | $262,500 |
| 2022 | $5,493 | $552,100 | $319,000 | $233,100 |
| 2021 | $7,193 | $523,100 | $290,000 | $233,100 |
| 2020 | $5,043 | $523,100 | $290,000 | $233,100 |
| 2019 | $4,917 | $469,200 | $271,000 | $198,200 |
| 2018 | $4,730 | $445,400 | $258,000 | $187,400 |
| 2017 | $4,656 | $445,400 | $258,000 | $187,400 |
| 2016 | $4,620 | $403,100 | $220,000 | $183,100 |
| 2015 | $4,643 | $409,100 | $220,000 | $189,100 |
| 2014 | $4,448 | $370,700 | $200,000 | $170,700 |
Source: Public Records
Map
Nearby Homes