11 Loreto St Providence, RI 02904
Charles NeighborhoodEstimated Value: $468,830 - $606,000
6
Beds
2
Baths
2,600
Sq Ft
$212/Sq Ft
Est. Value
About This Home
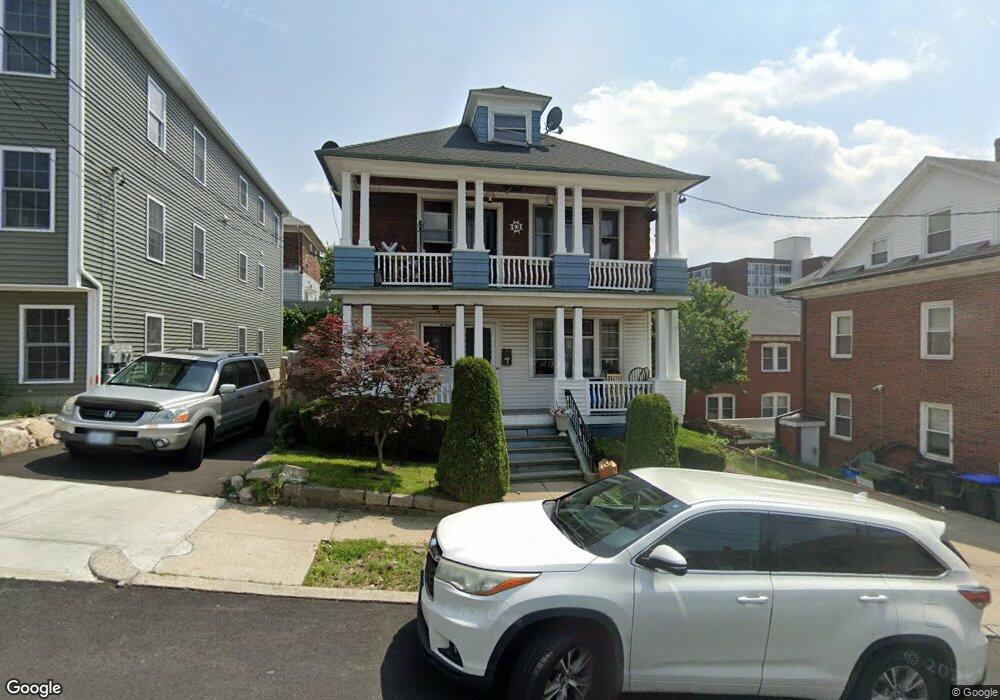
This home is located at 11 Loreto St, Providence, RI 02904 and is currently estimated at $552,208, approximately $212 per square foot. 11 Loreto St is a home located in Providence County with nearby schools including Asa Messer Elementary School, Charles N. Fortes Elementary School, and Veazie Street Elementary School.
Ownership History
Date
Name
Owned For
Owner Type
Purchase Details
Closed on
Dec 26, 2007
Sold by
Wells Fargo Bank Na
Bought by
Benitez Marvin F
Current Estimated Value
Home Financials for this Owner
Home Financials are based on the most recent Mortgage that was taken out on this home.
Original Mortgage
$149,600
Outstanding Balance
$94,544
Interest Rate
6.27%
Mortgage Type
Purchase Money Mortgage
Estimated Equity
$457,664
Purchase Details
Closed on
Oct 5, 2007
Sold by
Nunez Alejandro and Option One Mortgage Co
Bought by
Wells Fargo Bank Na
Purchase Details
Closed on
Nov 19, 2004
Sold by
Lamarra Helen and Iannuccilli Caludia
Bought by
Nunez Alejandro
Home Financials for this Owner
Home Financials are based on the most recent Mortgage that was taken out on this home.
Original Mortgage
$231,920
Interest Rate
5.8%
Mortgage Type
Purchase Money Mortgage
Create a Home Valuation Report for This Property
The Home Valuation Report is an in-depth analysis detailing your home's value as well as a comparison with similar homes in the area
Home Values in the Area
Average Home Value in this Area
Purchase History
| Date | Buyer | Sale Price | Title Company |
|---|---|---|---|
| Benitez Marvin F | $187,000 | -- | |
| Wells Fargo Bank Na | $260,501 | -- | |
| Nunez Alejandro | $290,000 | -- |
Source: Public Records
Mortgage History
| Date | Status | Borrower | Loan Amount |
|---|---|---|---|
| Open | Nunez Alejandro | $149,600 | |
| Closed | Nunez Alejandro | $37,400 | |
| Previous Owner | Nunez Alejandro | $231,920 |
Source: Public Records
Tax History Compared to Growth
Tax History
| Year | Tax Paid | Tax Assessment Tax Assessment Total Assessment is a certain percentage of the fair market value that is determined by local assessors to be the total taxable value of land and additions on the property. | Land | Improvement |
|---|---|---|---|---|
| 2025 | $3,509 | $464,800 | $127,500 | $337,300 |
| 2024 | $5,606 | $305,500 | $67,800 | $237,700 |
| 2023 | $5,606 | $305,500 | $67,800 | $237,700 |
| 2022 | $5,438 | $305,500 | $67,800 | $237,700 |
| 2021 | $5,084 | $207,000 | $60,800 | $146,200 |
| 2020 | $5,084 | $207,000 | $60,800 | $146,200 |
| 2019 | $5,084 | $207,000 | $60,800 | $146,200 |
| 2018 | $4,813 | $150,600 | $46,900 | $103,700 |
| 2017 | $4,813 | $150,600 | $46,900 | $103,700 |
| 2016 | $4,813 | $150,600 | $46,900 | $103,700 |
| 2015 | $4,469 | $135,000 | $49,700 | $85,300 |
| 2014 | $4,556 | $135,000 | $49,700 | $85,300 |
| 2013 | $4,556 | $135,000 | $49,700 | $85,300 |
Source: Public Records
Map
Nearby Homes
- 114 Commodore St
- 30 Touro St
- 54 Chatham St
- 508 Charles St
- 374 Branch Ave
- 512 Charles St
- 450-456 Charles St
- 34 Metcalf St
- 146 Silver Spring St
- 105 Metcalf St
- 0 Russo St
- 372 Hawkins St
- 57 Marietta St
- 108 Yorkshire St
- 123 Yorkshire St
- 148 Suffolk St Unit 150
- 120 Hawkins St
- 555 Branch Ave
- 62 Russo St
- 559 Branch Ave