
Seller's Agent in 2019
Diane Knisley
Stoudt Realty
(603) 235-7228
43 in this area
60 Total Sales
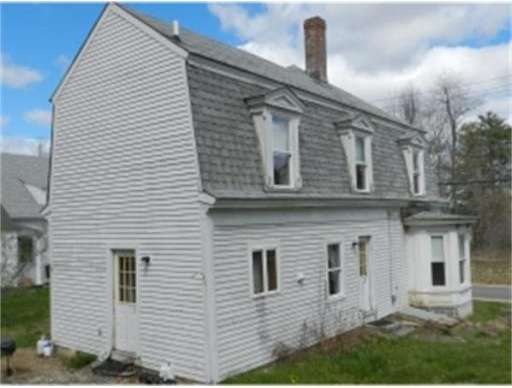
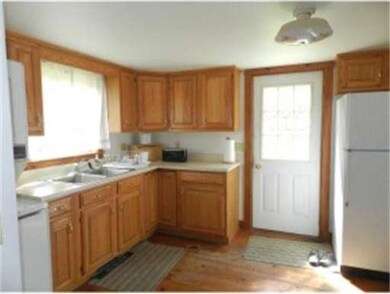
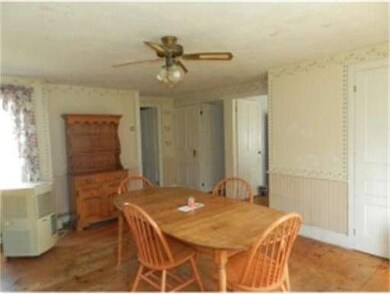
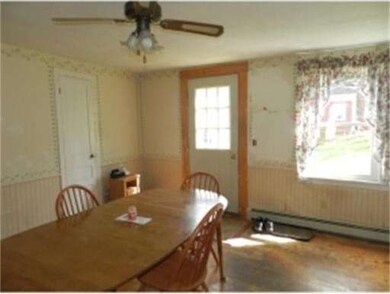
In town colonial with potential! This home has 3 bedrooms upstairs with sitting room and extra room perfect for storage. Downstairs has formal living room, dining room and 2 additional rooms, many different options available.
Last Buyer's Agent
Non Member
Non Member Office
Home Type
Single Family
Est. Annual Taxes
$6,214
Year Built
1840
Lot Details
0
| Date | Type | Sale Price | Title Company |
|---|---|---|---|
| Warranty Deed | $239,000 | -- |
| Date | Status | Loan Amount | Loan Type |
|---|---|---|---|
| Open | $191,200 | Purchase Money Mortgage | |
| Previous Owner | $100,704 | Unknown | |
| Previous Owner | $100,704 | Unknown |
| Date | Event | Price | Change | Sq Ft Price |
|---|---|---|---|---|
| 10/30/2019 10/30/19 | Sold | $239,000 | 0.0% | $107 / Sq Ft |
| 09/24/2019 09/24/19 | Pending | -- | -- | -- |
| 09/12/2019 09/12/19 | For Sale | $239,000 | +218.7% | $107 / Sq Ft |
| 04/30/2015 04/30/15 | Sold | $75,000 | 0.0% | $36 / Sq Ft |
| 04/30/2015 04/30/15 | Sold | $75,000 | -24.9% | $36 / Sq Ft |
| 02/04/2015 02/04/15 | Pending | -- | -- | -- |
| 02/04/2015 02/04/15 | Pending | -- | -- | -- |
| 12/10/2014 12/10/14 | For Sale | $99,900 | -23.1% | $48 / Sq Ft |
| 05/05/2014 05/05/14 | For Sale | $129,900 | -- | $63 / Sq Ft |
| Year | Tax Paid | Tax Assessment Tax Assessment Total Assessment is a certain percentage of the fair market value that is determined by local assessors to be the total taxable value of land and additions on the property. | Land | Improvement |
|---|---|---|---|---|
| 2024 | $6,214 | $408,300 | $95,000 | $313,300 |
| 2023 | $6,106 | $237,600 | $56,000 | $181,600 |
| 2022 | $5,586 | $237,600 | $56,000 | $181,600 |
| 2021 | $5,279 | $237,600 | $56,000 | $181,600 |
| 2020 | $0 | $203,600 | $56,000 | $147,600 |
| 2019 | $4,424 | $203,600 | $56,000 | $147,600 |
| 2018 | $4,795 | $177,900 | $58,000 | $119,900 |
| 2017 | $4,750 | $177,900 | $58,000 | $119,900 |
| 2016 | $4,666 | $177,900 | $58,000 | $119,900 |
| 2015 | $4,965 | $177,900 | $58,000 | $119,900 |
| 2014 | $4,931 | $177,900 | $58,000 | $119,900 |
| 2013 | $4,501 | $201,100 | $69,600 | $131,500 |
Seller's Agent in 2019
Diane Knisley
Stoudt Realty
(603) 235-7228
43 in this area
60 Total Sales
Buyer's Agent in 2019
Daniel Heroy
Cook & Cook Real Estate Group LLC
(603) 398-3969
2 in this area
31 Total Sales
Seller's Agent in 2015
Sandra Lehtonen
RE/MAX
(603) 878-2856
3 in this area
6 Total Sales
N
Buyer's Agent in 2015
Non Member
Non Member Office
Source: MLS Property Information Network (MLS PIN)
MLS Number: 71775908
APN: NIPS-000011-000000-000153
Disclaimer: Certain information contained herein is derived from information provided by parties other than Homes.com. All information provided is deemed reliable, but is not guaranteed to be accurate and should be independently verified.
![]() The property listing data and information, or the Images, set forth herein were provided to MLS Property Information Network, Inc. from third party sources, including sellers, lessors and public records, and were compiled by MLS Property Information Network, Inc. The property listing data and information, and the Images, are for the personal, non-commercial use of consumers having a good faith interest in purchasing or leasing listed properties of the type displayed to them and may not be used for any purpose other than to identify prospective properties which such consumers may have a good faith interest in purchasing or leasing. MLS Property Information Network, Inc. and its subscribers disclaim any and all representations and warranties as to the accuracy of the property listing data and information, or as to the accuracy of any of the Images, set forth herein.
The property listing data and information, or the Images, set forth herein were provided to MLS Property Information Network, Inc. from third party sources, including sellers, lessors and public records, and were compiled by MLS Property Information Network, Inc. The property listing data and information, and the Images, are for the personal, non-commercial use of consumers having a good faith interest in purchasing or leasing listed properties of the type displayed to them and may not be used for any purpose other than to identify prospective properties which such consumers may have a good faith interest in purchasing or leasing. MLS Property Information Network, Inc. and its subscribers disclaim any and all representations and warranties as to the accuracy of the property listing data and information, or as to the accuracy of any of the Images, set forth herein.