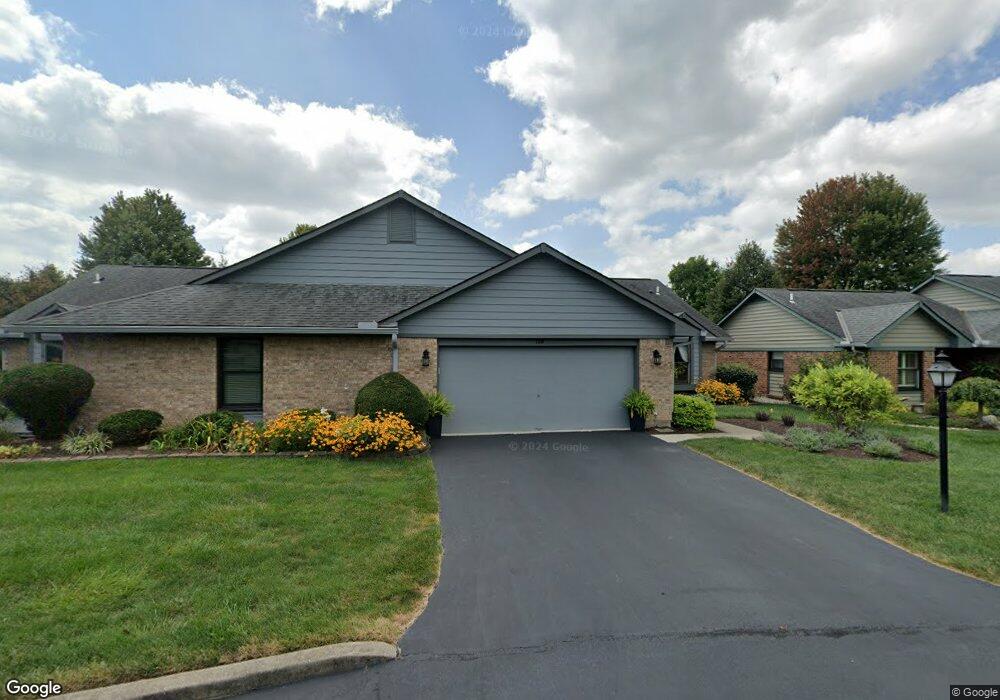
11 Montclair Ct Unit B Lebanon, OH 45036
Estimated Value: $298,000 - $306,145
3
Beds
2
Baths
1,504
Sq Ft
$200/Sq Ft
Est. Value
About This Home
This home is located at 11 Montclair Ct Unit B, Lebanon, OH 45036 and is currently estimated at $300,536, approximately $199 per square foot. 11 Montclair Ct Unit B is a home located in Warren County with nearby schools including Bowman Primary School, Berry Intermediate School, and Donovan Elementary School.
Ownership History
Date
Name
Owned For
Owner Type
Purchase Details
Closed on
Oct 19, 2023
Sold by
Wallace Linda
Bought by
Wallace Linda and Wallace Christopher
Current Estimated Value
Purchase Details
Closed on
Feb 4, 2019
Sold by
Sulfsted William C and Sulfsted Beverly J
Bought by
Sulfsted William C
Home Financials for this Owner
Home Financials are based on the most recent Mortgage that was taken out on this home.
Original Mortgage
$160,000
Interest Rate
4.5%
Mortgage Type
New Conventional
Purchase Details
Closed on
Jan 25, 2019
Sold by
Sulfsted William C and The Estate Of Robert George Su
Bought by
Wallace Linda
Home Financials for this Owner
Home Financials are based on the most recent Mortgage that was taken out on this home.
Original Mortgage
$160,000
Interest Rate
4.5%
Mortgage Type
New Conventional
Purchase Details
Closed on
Feb 13, 2010
Sold by
Sulfsted Robert G
Bought by
Sulfsted William C and Sulfsted Beverly J
Purchase Details
Closed on
Oct 17, 1996
Sold by
Shirley F Byrd
Bought by
Sulfsted Robert G
Purchase Details
Closed on
Jul 13, 1992
Sold by
Oberer Development Co
Bought by
Byrd and Byrd Walton E
Purchase Details
Closed on
Sep 12, 1989
Sold by
Oberer Development Co
Bought by
Oberer Development Co.
Create a Home Valuation Report for This Property
The Home Valuation Report is an in-depth analysis detailing your home's value as well as a comparison with similar homes in the area
Home Values in the Area
Average Home Value in this Area
Purchase History
| Date | Buyer | Sale Price | Title Company |
|---|---|---|---|
| Wallace Linda | -- | None Listed On Document | |
| Sulfsted William C | -- | None Available | |
| Wallace Linda | $200,000 | None Available | |
| Sulfsted William C | $120,000 | None Available | |
| Sulfsted Robert G | $123,500 | -- | |
| Byrd | $105,500 | -- | |
| Oberer Development Co. | -- | -- |
Source: Public Records
Mortgage History
| Date | Status | Borrower | Loan Amount |
|---|---|---|---|
| Previous Owner | Wallace Linda | $160,000 |
Source: Public Records
Tax History Compared to Growth
Tax History
| Year | Tax Paid | Tax Assessment Tax Assessment Total Assessment is a certain percentage of the fair market value that is determined by local assessors to be the total taxable value of land and additions on the property. | Land | Improvement |
|---|---|---|---|---|
| 2024 | $3,581 | $86,230 | $19,250 | $66,980 |
| 2023 | $3,245 | $70,224 | $10,762 | $59,461 |
| 2022 | $3,383 | $70,224 | $10,763 | $59,462 |
| 2021 | $3,263 | $70,224 | $10,763 | $59,462 |
| 2020 | $3,140 | $57,092 | $8,750 | $48,342 |
| 2019 | $2,618 | $57,092 | $8,750 | $48,342 |
| 2018 | $2,244 | $57,092 | $8,750 | $48,342 |
| 2017 | $2,234 | $51,930 | $8,092 | $43,838 |
| 2016 | $2,304 | $51,930 | $8,092 | $43,838 |
| 2015 | $2,321 | $51,930 | $8,092 | $43,838 |
| 2014 | $2,227 | $48,530 | $7,560 | $40,970 |
| 2013 | $2,061 | $54,380 | $8,750 | $45,630 |
Source: Public Records
Map
Nearby Homes
- 11 Montclair Ct Unit A
- 10 Montclair Ct Unit A
- 10 Montclair Ct Unit B
- 10 Montclair Ct
- 9 Claridge Ct Unit A
- 9 Claridge Ct Unit B
- 12 Montclair Ct Unit B
- 12 Montclair Ct
- 12 Montclair Ct
- 8 Claridge Ct
- 8 Claridge Ct
- 8 Claridge Ct Unit A
- B Montclaire Ct
- 17 Montclair Ct
- 17 Montclair Ct Unit B
- 13 Montclair Ct Unit B
- 13 Montclair Ct Unit A
- 13 Montclair Ct
- 3A Shaker Run Rd
- 16 Montclair Ct