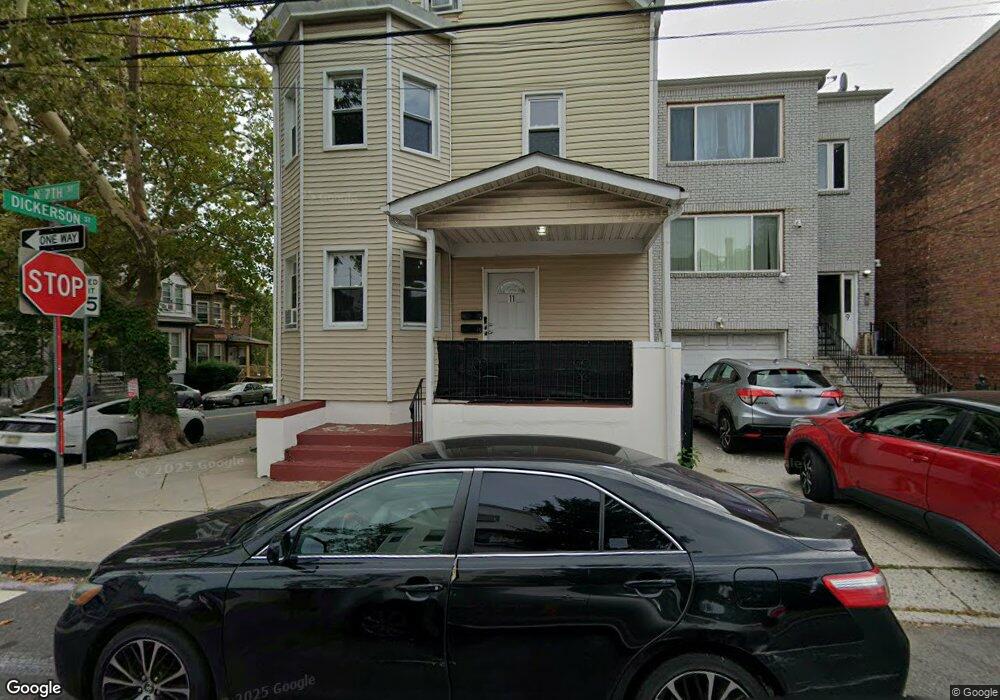
11 N 7th St Unit 3 Newark, NJ 07107
Fairmount NeighborhoodEstimated Value: $497,216 - $796,000
7
Beds
3
Baths
3,024
Sq Ft
$228/Sq Ft
Est. Value
About This Home
This home is located at 11 N 7th St Unit 3, Newark, NJ 07107 and is currently estimated at $688,304, approximately $227 per square foot. 11 N 7th St Unit 3 is a home located in Essex County with nearby schools including Sir Isaac Newton Elementary School, Camden Street Elementary School, and Cleveland Elementary School.
Ownership History
Date
Name
Owned For
Owner Type
Purchase Details
Closed on
Jan 5, 2018
Sold by
Paramount Home Dev Llc
Bought by
Hamlor Jefferey
Current Estimated Value
Home Financials for this Owner
Home Financials are based on the most recent Mortgage that was taken out on this home.
Original Mortgage
$333,841
Outstanding Balance
$277,261
Interest Rate
3.75%
Mortgage Type
FHA
Estimated Equity
$411,043
Purchase Details
Closed on
May 6, 2016
Sold by
Rebelo Jose
Bought by
Paramount Home And Development Llc
Purchase Details
Closed on
Dec 30, 2009
Sold by
City Of Newark
Bought by
Rebelo Jose
Purchase Details
Closed on
Aug 12, 1991
Sold by
The City Of Newark
Bought by
Rebelo Jose
Create a Home Valuation Report for This Property
The Home Valuation Report is an in-depth analysis detailing your home's value as well as a comparison with similar homes in the area
Home Values in the Area
Average Home Value in this Area
Purchase History
| Date | Buyer | Sale Price | Title Company |
|---|---|---|---|
| Hamlor Jefferey | $340,000 | -- | |
| Paramount Home And Development Llc | $120,000 | None Available | |
| Rebelo Jose | -- | None Available | |
| Rebelo Jose | $500 | -- |
Source: Public Records
Mortgage History
| Date | Status | Borrower | Loan Amount |
|---|---|---|---|
| Open | Hamlor Jefferey | $333,841 |
Source: Public Records
Tax History
| Year | Tax Paid | Tax Assessment Tax Assessment Total Assessment is a certain percentage of the fair market value that is determined by local assessors to be the total taxable value of land and additions on the property. | Land | Improvement |
|---|---|---|---|---|
| 2025 | $6,427 | $169,000 | $21,300 | $147,700 |
| 2024 | $6,300 | $169,000 | $21,300 | $147,700 |
| 2022 | $6,314 | $169,000 | $21,300 | $147,700 |
| 2021 | $6,310 | $169,000 | $21,300 | $147,700 |
| 2020 | $6,422 | $169,000 | $21,300 | $147,700 |
| 2019 | $6,356 | $169,000 | $21,300 | $147,700 |
| 2018 | $6,241 | $169,000 | $21,300 | $147,700 |
| 2017 | $6,016 | $169,000 | $21,300 | $147,700 |
| 2016 | $5,814 | $169,000 | $21,300 | $147,700 |
| 2015 | $5,592 | $169,000 | $21,300 | $147,700 |
| 2014 | $5,241 | $169,000 | $21,300 | $147,700 |
Source: Public Records
Map
Nearby Homes
Your Personal Tour Guide
Ask me questions while you tour the home.