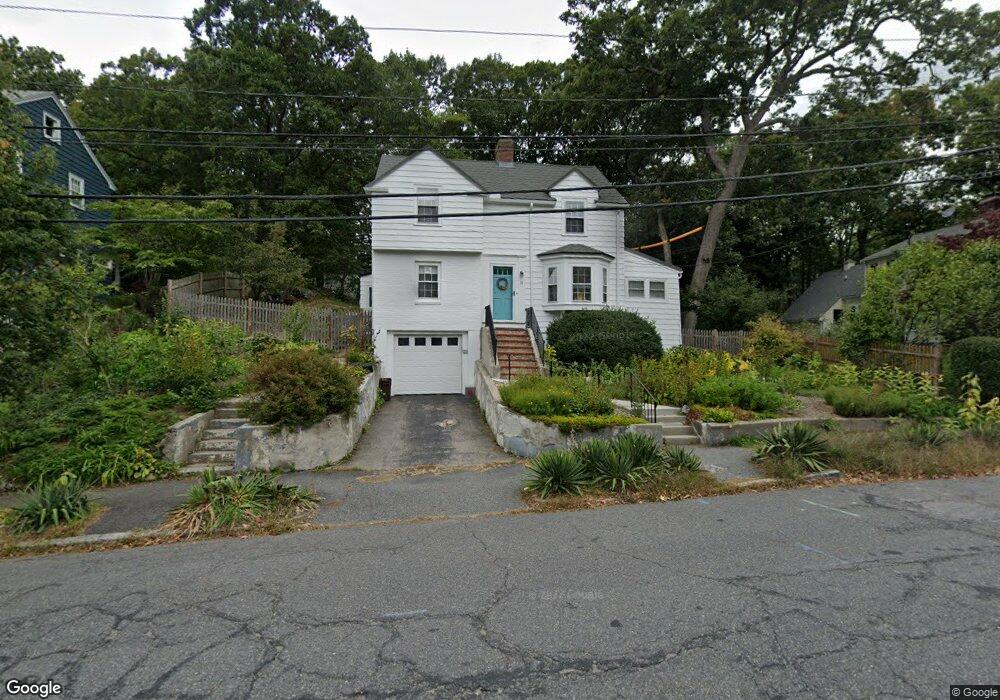
11 Risley Rd Chestnut Hill, MA 02467
South Brookline NeighborhoodEstimated Value: $1,165,000 - $1,239,000
3
Beds
2
Baths
1,596
Sq Ft
$752/Sq Ft
Est. Value
About This Home
This home is located at 11 Risley Rd, Chestnut Hill, MA 02467 and is currently estimated at $1,199,538, approximately $751 per square foot. 11 Risley Rd is a home located in Norfolk County with nearby schools including Baker School, Brookline High School, and Holy Name Parish School.
Ownership History
Date
Name
Owned For
Owner Type
Purchase Details
Closed on
Dec 7, 2017
Sold by
Rounseville Anne E
Bought by
Anne E Rounseville T
Current Estimated Value
Purchase Details
Closed on
Aug 10, 1990
Sold by
Achir Agoes
Bought by
Cote Paul J
Home Financials for this Owner
Home Financials are based on the most recent Mortgage that was taken out on this home.
Original Mortgage
$208,879
Interest Rate
10.04%
Mortgage Type
Purchase Money Mortgage
Create a Home Valuation Report for This Property
The Home Valuation Report is an in-depth analysis detailing your home's value as well as a comparison with similar homes in the area
Home Values in the Area
Average Home Value in this Area
Purchase History
| Date | Buyer | Sale Price | Title Company |
|---|---|---|---|
| Anne E Rounseville T | -- | -- | |
| Cote Paul J | $225,000 | -- |
Source: Public Records
Mortgage History
| Date | Status | Borrower | Loan Amount |
|---|---|---|---|
| Previous Owner | Cote Paul J | $191,000 | |
| Previous Owner | Cote Paul J | $208,879 | |
| Previous Owner | Cote Paul J | $189,000 |
Source: Public Records
Tax History
| Year | Tax Paid | Tax Assessment Tax Assessment Total Assessment is a certain percentage of the fair market value that is determined by local assessors to be the total taxable value of land and additions on the property. | Land | Improvement |
|---|---|---|---|---|
| 2025 | $10,575 | $1,071,400 | $688,000 | $383,400 |
| 2024 | $10,062 | $1,029,900 | $661,600 | $368,300 |
| 2023 | $9,199 | $922,700 | $536,400 | $386,300 |
| 2022 | $8,954 | $878,700 | $510,800 | $367,900 |
| 2021 | $8,280 | $844,900 | $491,200 | $353,700 |
| 2020 | $7,511 | $794,800 | $446,600 | $348,200 |
| 2019 | $7,028 | $750,100 | $425,300 | $324,800 |
| 2018 | $7,037 | $743,900 | $425,400 | $318,500 |
| 2017 | $6,934 | $701,800 | $401,300 | $300,500 |
| 2016 | $6,834 | $655,900 | $375,000 | $280,900 |
| 2015 | $6,547 | $613,000 | $350,500 | $262,500 |
| 2014 | $6,505 | $571,100 | $318,700 | $252,400 |
Source: Public Records
Map
Nearby Homes
- 67 Risley Rd
- 206 Allandale Rd Unit 3C
- 214 Allandale Rd Unit B
- 91 Grove St
- 17 Fairgreen Place
- 55 Fairgreen Place
- 55 Bellingham Rd
- 37 Morey Rd
- 227 Bonad Rd
- 87 Buchanan Rd
- 36 Goodnough Rd
- 170 Bonad Rd
- 33 Meadowbrook Rd
- 72 Wallis Rd
- 12 Allandale St
- 333 Goddard Ave Unit 333
- 60 Alberta Rd
- 2 Brownson Terrace
- 2 Weld Hill St Unit PH2
- 7 Rambler Rd
Your Personal Tour Guide
Ask me questions while you tour the home.