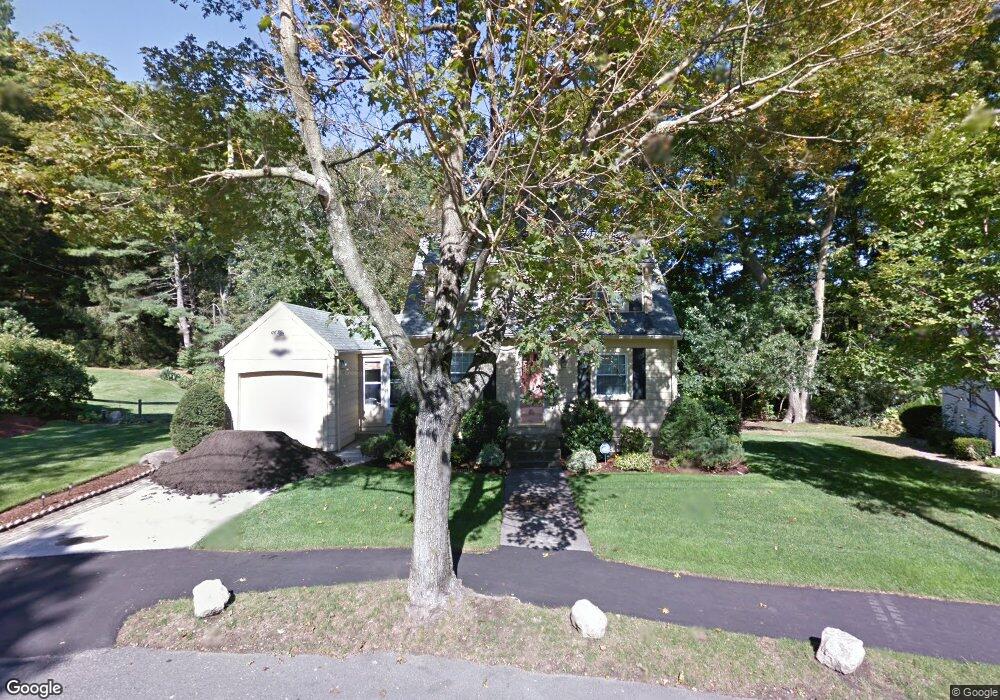
11 Robert St Wakefield, MA 01880
Greenwood NeighborhoodEstimated Value: $817,000 - $935,000
3
Beds
2
Baths
1,629
Sq Ft
$526/Sq Ft
Est. Value
About This Home
This home is located at 11 Robert St, Wakefield, MA 01880 and is currently estimated at $856,483, approximately $525 per square foot. 11 Robert St is a home located in Middlesex County with nearby schools including Wakefield Memorial High School, St Joseph School, and St. Patrick Elementary School.
Ownership History
Date
Name
Owned For
Owner Type
Purchase Details
Closed on
Dec 12, 2025
Sold by
Sorrenti Mario C
Bought by
11 Robert Street Irt and Sorrenti
Current Estimated Value
Purchase Details
Closed on
Jul 26, 2010
Sold by
Crabb Blanche A
Bought by
Sorrenti Mario C
Home Financials for this Owner
Home Financials are based on the most recent Mortgage that was taken out on this home.
Original Mortgage
$300,000
Interest Rate
4.76%
Mortgage Type
Purchase Money Mortgage
Create a Home Valuation Report for This Property
The Home Valuation Report is an in-depth analysis detailing your home's value as well as a comparison with similar homes in the area
Home Values in the Area
Average Home Value in this Area
Purchase History
| Date | Buyer | Sale Price | Title Company |
|---|---|---|---|
| 11 Robert Street Irt | -- | -- | |
| Sorrenti Mario C | $375,000 | -- | |
| Sorrenti Mario C | $375,000 | -- |
Source: Public Records
Mortgage History
| Date | Status | Borrower | Loan Amount |
|---|---|---|---|
| Previous Owner | Sorrenti Mario C | $300,000 |
Source: Public Records
Tax History
| Year | Tax Paid | Tax Assessment Tax Assessment Total Assessment is a certain percentage of the fair market value that is determined by local assessors to be the total taxable value of land and additions on the property. | Land | Improvement |
|---|---|---|---|---|
| 2025 | $8,652 | $762,300 | $436,600 | $325,700 |
| 2024 | $7,979 | $709,200 | $406,200 | $303,000 |
| 2023 | $7,593 | $647,300 | $379,100 | $268,200 |
| 2022 | $7,121 | $578,000 | $338,500 | $239,500 |
| 2021 | $6,906 | $542,500 | $310,400 | $232,100 |
| 2020 | $6,495 | $508,600 | $291,000 | $217,600 |
| 2019 | $6,090 | $474,700 | $271,600 | $203,100 |
| 2018 | $5,872 | $453,400 | $259,500 | $193,900 |
| 2017 | $5,521 | $423,700 | $242,500 | $181,200 |
| 2016 | $5,519 | $409,100 | $239,700 | $169,400 |
| 2015 | $5,152 | $382,200 | $223,900 | $158,300 |
| 2014 | $4,729 | $370,000 | $218,500 | $151,500 |
Source: Public Records
Map
Nearby Homes
Your Personal Tour Guide
Ask me questions while you tour the home.