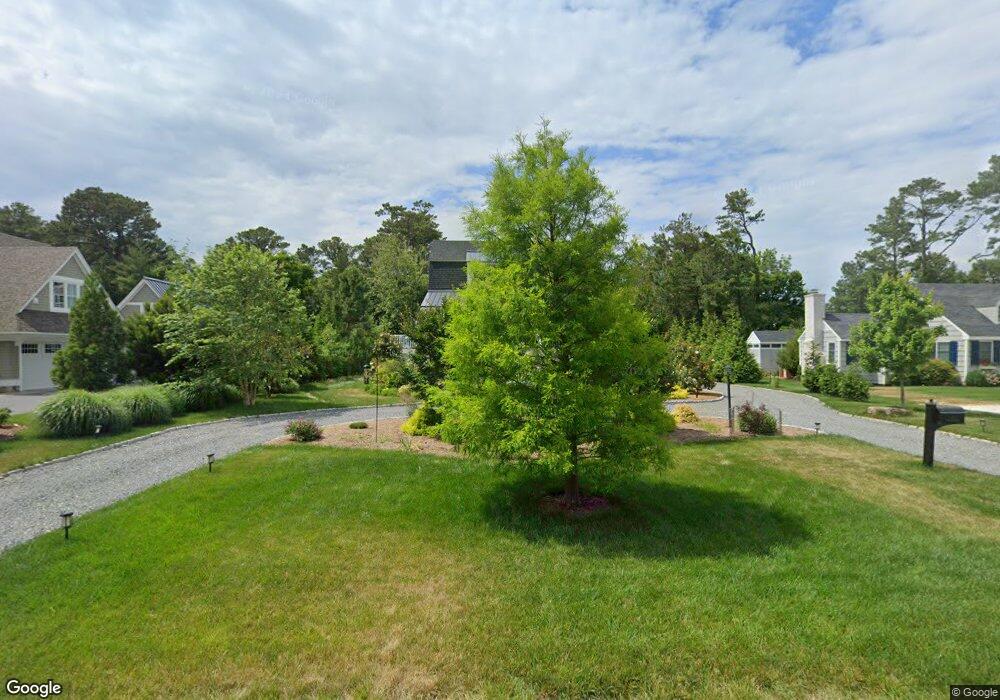
11 Rolling Rd Rehoboth Beach, DE 19971
Estimated Value: $2,744,000 - $4,065,000
4
Beds
--
Bath
5,144
Sq Ft
$662/Sq Ft
Est. Value
About This Home
This home is located at 11 Rolling Rd, Rehoboth Beach, DE 19971 and is currently estimated at $3,404,500, approximately $661 per square foot. 11 Rolling Rd is a home located in Sussex County with nearby schools including Rehoboth Elementary School, Mariner Middle School, and Cape Henlopen High School.
Ownership History
Date
Name
Owned For
Owner Type
Purchase Details
Closed on
Dec 23, 2020
Sold by
Kaplan David E
Bought by
Julia Marx Irt
Current Estimated Value
Purchase Details
Closed on
Nov 20, 2017
Sold by
Poole Donald W and Poole 3Rd Donald W
Bought by
Kaplan David E and Marx Julia
Purchase Details
Closed on
Nov 16, 2017
Sold by
Poole Donald W and Poole 3Rd Donald W
Bought by
Kaplan David E and Marx Julia
Create a Home Valuation Report for This Property
The Home Valuation Report is an in-depth analysis detailing your home's value as well as a comparison with similar homes in the area
Home Values in the Area
Average Home Value in this Area
Purchase History
| Date | Buyer | Sale Price | Title Company |
|---|---|---|---|
| Julia Marx Irt | -- | None Available | |
| Kaplan David E | -- | None Available | |
| Kaplan David E | $1,395,000 | -- | |
| Kaplan David E | $1,395,000 | -- |
Source: Public Records
Tax History
| Year | Tax Paid | Tax Assessment Tax Assessment Total Assessment is a certain percentage of the fair market value that is determined by local assessors to be the total taxable value of land and additions on the property. | Land | Improvement |
|---|---|---|---|---|
| 2025 | $8,316 | $15,600 | $15,600 | $0 |
| 2024 | $3,845 | $15,600 | $15,600 | $0 |
| 2023 | $3,842 | $15,600 | $15,600 | $0 |
| 2022 | $3,719 | $15,600 | $15,600 | $0 |
| 2021 | $3,688 | $15,600 | $15,600 | $0 |
| 2020 | $3,677 | $15,600 | $15,600 | $0 |
| 2019 | $1,030 | $15,600 | $15,600 | $0 |
| 2018 | $685 | $15,600 | $0 | $0 |
| 2017 | $656 | $15,600 | $0 | $0 |
| 2016 | $623 | $15,600 | $0 | $0 |
| 2015 | $595 | $15,600 | $0 | $0 |
| 2014 | $591 | $15,600 | $0 | $0 |
Source: Public Records
Map
Nearby Homes
- 21 Cedar Rd
- 21 Ocean Dr Unit 904
- 52 Henlopen Ave
- 40 Park Ave
- 69 Henlopen Ave
- 527 North Boardwalk Unit 202
- 527 North Boardwalk Unit 205
- 10 Virginia Ave
- 8 Olive Ave Unit 205
- 29 Maryland Ave Unit 101
- 49 Maryland Ave Unit A
- 11 Cookman St
- 45 Baltimore Ave
- 41243 Gloucester Dr
- 37419 Liverpool Ln
- 37520 Worcester Dr
- 70 Sussex St
- 50 Wilmington Ave Unit 103
- 158 Henlopen Ave Unit 8
- 47 Thompson Ct
- 11 Rolling Rd Unit 12
- 9 Rolling Rd
- 13 Rolling Rd
- 14 Tidewaters Rd
- 7 Rolling Rd
- 8 Zwaanendael Rd
- 12 Tidewater Rd
- 10 Rolling Rd
- 8 Rolling Rd
- 6 Rolling Rd
- 5 Rolling Rd
- 10 Tidewaters Rd
- 4 Rolling Rd
- 15 Tidewater Rd
- 13 Tidewaters Rd
- 17 Tidewater Rd
- 4 Zwaanendael Rd
- 21 Rolling Rd
- 20 Tidewaters Rd
- 5 Pine Reach Rd
Your Personal Tour Guide
Ask me questions while you tour the home.