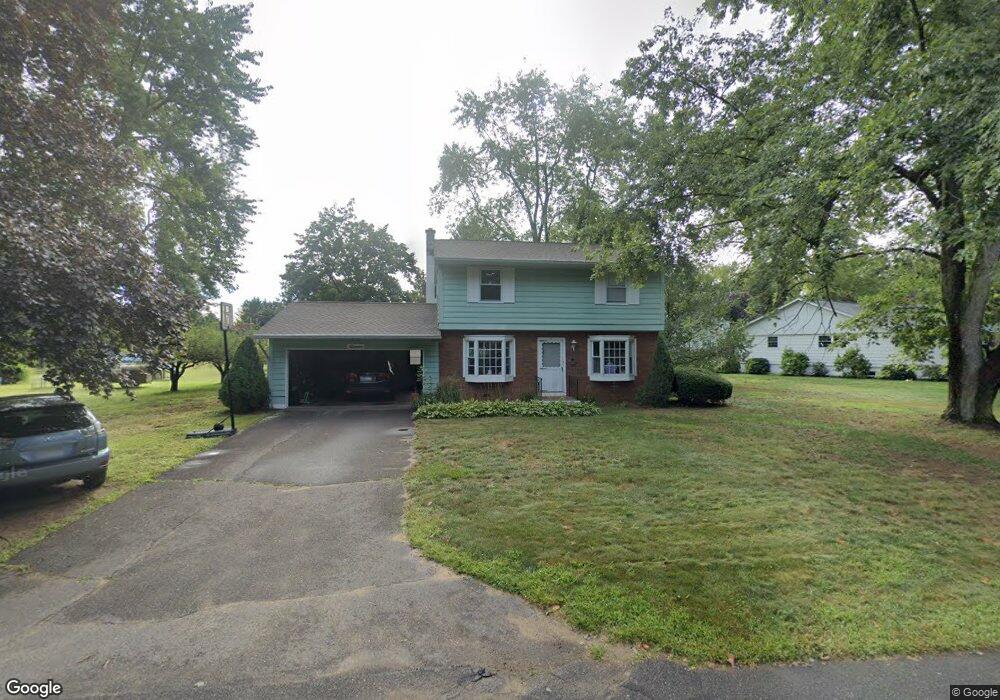
11 Skyline Dr South Hadley, MA 01075
Estimated Value: $428,659 - $461,000
4
Beds
2
Baths
1,540
Sq Ft
$287/Sq Ft
Est. Value
About This Home
This home is located at 11 Skyline Dr, South Hadley, MA 01075 and is currently estimated at $442,165, approximately $287 per square foot. 11 Skyline Dr is a home located in Hampshire County with nearby schools including Plains Elementary School, Mosier Elementary School, and Michael E. Smith Middle School.
Ownership History
Date
Name
Owned For
Owner Type
Purchase Details
Closed on
Nov 3, 2017
Sold by
Fortunato Anthony L
Bought by
Griffis Thomas J and Oshea Kathleen
Current Estimated Value
Home Financials for this Owner
Home Financials are based on the most recent Mortgage that was taken out on this home.
Original Mortgage
$228,650
Outstanding Balance
$191,496
Interest Rate
3.83%
Mortgage Type
New Conventional
Estimated Equity
$250,669
Purchase Details
Closed on
Feb 10, 2010
Sold by
Labarre Doreen A
Bought by
Labarre Michael and Labarre Doreen A
Purchase Details
Closed on
Nov 15, 2000
Sold by
Paddock Jordan H and Paddock Judith A
Bought by
Goss Doreen A
Home Financials for this Owner
Home Financials are based on the most recent Mortgage that was taken out on this home.
Original Mortgage
$92,000
Interest Rate
7.78%
Mortgage Type
Purchase Money Mortgage
Create a Home Valuation Report for This Property
The Home Valuation Report is an in-depth analysis detailing your home's value as well as a comparison with similar homes in the area
Home Values in the Area
Average Home Value in this Area
Purchase History
| Date | Buyer | Sale Price | Title Company |
|---|---|---|---|
| Griffis Thomas J | $269,000 | -- | |
| Labarre Michael | -- | -- | |
| Goss Doreen A | $115,000 | -- |
Source: Public Records
Mortgage History
| Date | Status | Borrower | Loan Amount |
|---|---|---|---|
| Open | Griffis Thomas J | $228,650 | |
| Previous Owner | Goss Doreen A | $92,000 |
Source: Public Records
Tax History Compared to Growth
Tax History
| Year | Tax Paid | Tax Assessment Tax Assessment Total Assessment is a certain percentage of the fair market value that is determined by local assessors to be the total taxable value of land and additions on the property. | Land | Improvement |
|---|---|---|---|---|
| 2025 | $5,872 | $368,600 | $141,400 | $227,200 |
| 2024 | $5,881 | $353,200 | $132,100 | $221,100 |
| 2023 | $5,755 | $327,900 | $120,000 | $207,900 |
| 2022 | $5,535 | $299,500 | $120,000 | $179,500 |
| 2021 | $5,457 | $280,400 | $112,000 | $168,400 |
| 2020 | $5,340 | $267,800 | $112,000 | $155,800 |
| 2019 | $5,168 | $256,500 | $106,900 | $149,600 |
| 2018 | $4,969 | $249,300 | $103,800 | $145,500 |
| 2017 | $4,801 | $238,600 | $103,800 | $134,800 |
| 2016 | $4,528 | $228,100 | $94,500 | $133,600 |
| 2015 | $4,295 | $221,600 | $91,900 | $129,700 |
Source: Public Records
Map
Nearby Homes
- 75 Pine St
- 85 Fairview St
- 88 Alvord St
- 19 Hildreth Ave
- 120 Camden St
- 34 Hildreth Ave
- 108 College St
- 96 College St
- 4 Sunrise Cir
- 84 Judd Ave
- 70 Lathrop St
- 133 Granby Rd
- 0 Granby Rd
- 17 Woodbridge St
- 35 Yale St
- 540 Granby Rd Unit 72A
- 540 Granby Rd Unit 109
- 540 Granby Rd Unit 62
- 540 Granby Rd Unit 2
- Lot 1 Edgewater Ln