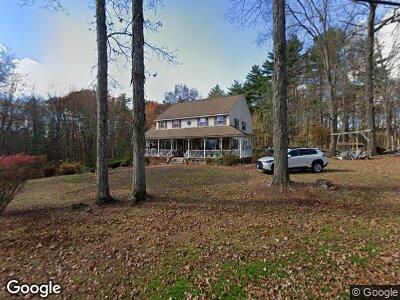
11 South Rd South Hampton, NH 03827
Estimated Value: $577,000 - $907,405
4
Beds
4
Baths
4,445
Sq Ft
$183/Sq Ft
Est. Value
About This Home
This home is located at 11 South Rd, South Hampton, NH 03827 and is currently estimated at $813,851, approximately $183 per square foot. 11 South Rd is a home located in Rockingham County with nearby schools including South Hampton Barnard School, Winnacunnet High School, and Amesbury Seventh-Day Adventist School.
Ownership History
Date
Name
Owned For
Owner Type
Purchase Details
Closed on
Sep 26, 2001
Sold by
Levesque Alfred J and Levesque Cecilia
Bought by
Kataxinos Anthony G
Current Estimated Value
Home Financials for this Owner
Home Financials are based on the most recent Mortgage that was taken out on this home.
Original Mortgage
$279,900
Interest Rate
6.91%
Create a Home Valuation Report for This Property
The Home Valuation Report is an in-depth analysis detailing your home's value as well as a comparison with similar homes in the area
Home Values in the Area
Average Home Value in this Area
Purchase History
| Date | Buyer | Sale Price | Title Company |
|---|---|---|---|
| Kataxinos Anthony G | $349,900 | -- |
Source: Public Records
Mortgage History
| Date | Status | Borrower | Loan Amount |
|---|---|---|---|
| Open | Kataxinos Anthony G | $260,700 | |
| Closed | Kataxinos Anthony G | $290,550 | |
| Closed | Kataxinos Anthony G | $120,000 | |
| Closed | Kataxinos Anthony G | $279,900 |
Source: Public Records
Tax History Compared to Growth
Tax History
| Year | Tax Paid | Tax Assessment Tax Assessment Total Assessment is a certain percentage of the fair market value that is determined by local assessors to be the total taxable value of land and additions on the property. | Land | Improvement |
|---|---|---|---|---|
| 2024 | $11,929 | $864,400 | $290,300 | $574,100 |
| 2023 | $11,929 | $864,400 | $290,300 | $574,100 |
| 2022 | $11,044 | $556,100 | $167,100 | $389,000 |
| 2021 | $11,083 | $556,100 | $167,100 | $389,000 |
| 2020 | $10,560 | $556,100 | $167,100 | $389,000 |
| 2019 | $9,926 | $556,100 | $167,100 | $389,000 |
| 2018 | $9,143 | $548,500 | $167,100 | $381,400 |
| 2017 | $8,192 | $425,800 | $141,800 | $284,000 |
| 2016 | $7,762 | $425,800 | $141,800 | $284,000 |
| 2015 | $8,486 | $425,800 | $141,800 | $284,000 |
| 2014 | $7,962 | $425,800 | $141,800 | $284,000 |
| 2012 | $7,872 | $533,700 | $201,900 | $331,800 |
Source: Public Records
Map
Nearby Homes