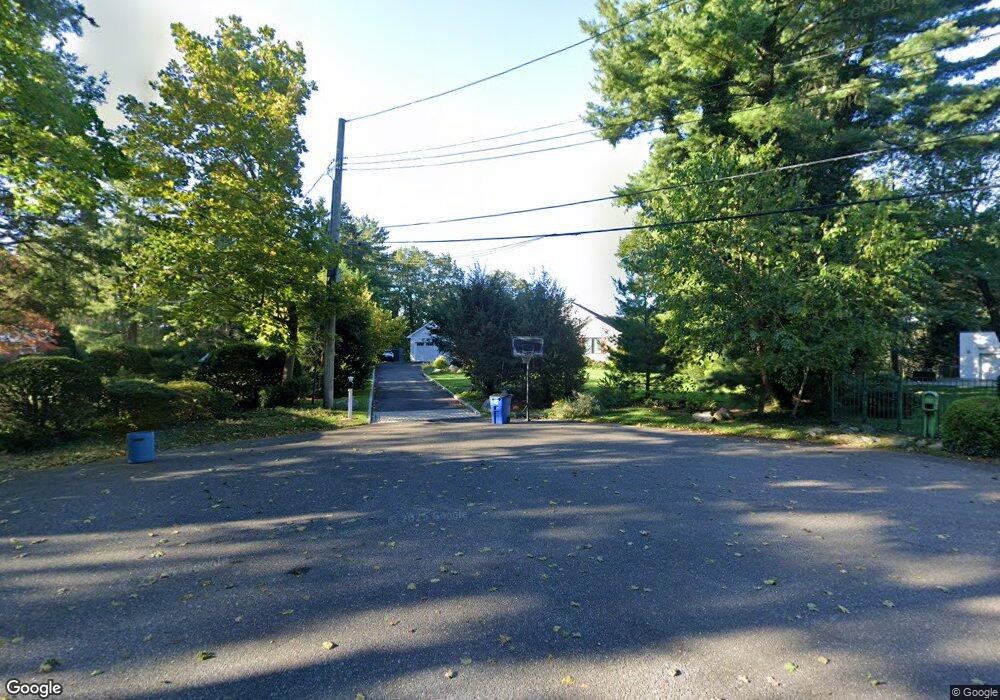
11 South Run Cold Spring Harbor, NY 11724
Estimated Value: $1,344,116 - $2,110,000
6
Beds
3
Baths
2,500
Sq Ft
$647/Sq Ft
Est. Value
About This Home
This home is located at 11 South Run, Cold Spring Harbor, NY 11724 and is currently estimated at $1,617,779, approximately $647 per square foot. 11 South Run is a home located in Suffolk County with nearby schools including West Side Elementary School, Goosehill Primary Center, and Cold Spring Harbor High School.
Ownership History
Date
Name
Owned For
Owner Type
Purchase Details
Closed on
Sep 22, 2016
Sold by
Baumann Nancy and Weigel Family Trust
Bought by
Rasmussen Christina M
Current Estimated Value
Home Financials for this Owner
Home Financials are based on the most recent Mortgage that was taken out on this home.
Original Mortgage
$637,500
Outstanding Balance
$509,210
Interest Rate
3.43%
Mortgage Type
New Conventional
Estimated Equity
$1,108,569
Purchase Details
Closed on
Jun 17, 2015
Sold by
Weigel Richard
Bought by
Baumann Nancy and Weigel Family Trust
Purchase Details
Closed on
Jan 21, 2015
Sold by
Weigel Richard and Weigel Ruth
Bought by
Weigel Richard
Create a Home Valuation Report for This Property
The Home Valuation Report is an in-depth analysis detailing your home's value as well as a comparison with similar homes in the area
Home Values in the Area
Average Home Value in this Area
Purchase History
| Date | Buyer | Sale Price | Title Company |
|---|---|---|---|
| Rasmussen Christina M | $750,000 | None Available | |
| Rasmussen Christina M | $750,000 | None Available | |
| Baumann Nancy | -- | None Available | |
| Baumann Nancy | -- | None Available | |
| Weigel Richard | -- | None Available | |
| Weigel Richard | -- | None Available |
Source: Public Records
Mortgage History
| Date | Status | Borrower | Loan Amount |
|---|---|---|---|
| Open | Rasmussen Christina M | $637,500 | |
| Closed | Rasmussen Christina M | $637,500 |
Source: Public Records
Tax History Compared to Growth
Tax History
| Year | Tax Paid | Tax Assessment Tax Assessment Total Assessment is a certain percentage of the fair market value that is determined by local assessors to be the total taxable value of land and additions on the property. | Land | Improvement |
|---|---|---|---|---|
| 2024 | $22,727 | $6,775 | $1,100 | $5,675 |
| 2023 | $18,453 | $5,650 | $1,100 | $4,550 |
| 2022 | $17,953 | $4,900 | $1,100 | $3,800 |
| 2021 | $17,651 | $4,900 | $1,100 | $3,800 |
| 2020 | $17,721 | $4,900 | $1,100 | $3,800 |
| 2019 | $35,441 | $0 | $0 | $0 |
| 2018 | $20,706 | $4,900 | $1,100 | $3,800 |
| 2017 | $20,706 | $4,900 | $1,100 | $3,800 |
| 2016 | $9,964 | $4,900 | $1,100 | $3,800 |
| 2015 | -- | $4,900 | $1,100 | $3,800 |
| 2014 | -- | $4,900 | $1,100 | $3,800 |
Source: Public Records
Map
Nearby Homes