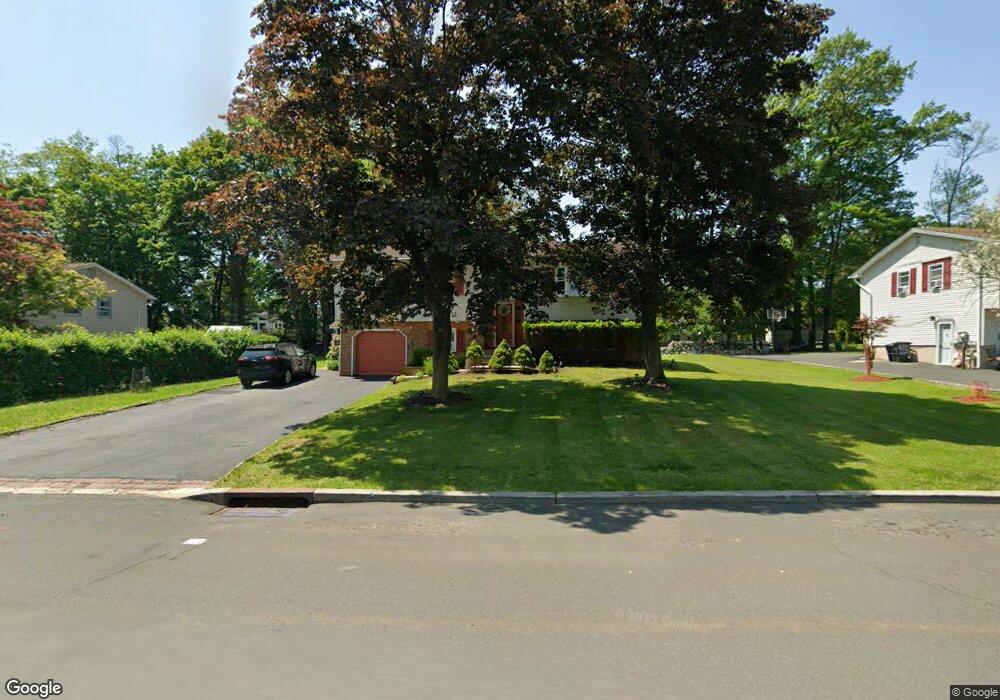
11 Southpark Dr Garnerville, NY 10923
Estimated Value: $684,000 - $780,000
4
Beds
3
Baths
2,172
Sq Ft
$335/Sq Ft
Est. Value
About This Home
This home is located at 11 Southpark Dr, Garnerville, NY 10923 and is currently estimated at $726,600, approximately $334 per square foot. 11 Southpark Dr is a home located in Rockland County with nearby schools including West Haverstraw Elementary School, Haverstraw Elementary School, and Fieldstone Secondary School.
Ownership History
Date
Name
Owned For
Owner Type
Purchase Details
Closed on
Dec 13, 2010
Sold by
Federal National Mortgage Association
Bought by
Anim Jeffrey and Anim Joyce
Current Estimated Value
Home Financials for this Owner
Home Financials are based on the most recent Mortgage that was taken out on this home.
Original Mortgage
$236,000
Outstanding Balance
$155,523
Interest Rate
4.17%
Mortgage Type
New Conventional
Estimated Equity
$571,077
Purchase Details
Closed on
May 27, 2010
Sold by
Murphy Diane and Walsh Robert
Bought by
Federal National Mortgage Association
Purchase Details
Closed on
May 30, 2001
Sold by
Velez Beatrice Cubero and Velez Jose
Bought by
Murphy Diane
Home Financials for this Owner
Home Financials are based on the most recent Mortgage that was taken out on this home.
Original Mortgage
$231,200
Interest Rate
7.15%
Create a Home Valuation Report for This Property
The Home Valuation Report is an in-depth analysis detailing your home's value as well as a comparison with similar homes in the area
Home Values in the Area
Average Home Value in this Area
Purchase History
| Date | Buyer | Sale Price | Title Company |
|---|---|---|---|
| Anim Jeffrey | $295,000 | None Available | |
| Federal National Mortgage Association | $231,000 | None Available | |
| Murphy Diane | $289,000 | Fidelity National Title Ins |
Source: Public Records
Mortgage History
| Date | Status | Borrower | Loan Amount |
|---|---|---|---|
| Open | Anim Jeffrey | $236,000 | |
| Previous Owner | Murphy Diane | $231,200 |
Source: Public Records
Tax History Compared to Growth
Tax History
| Year | Tax Paid | Tax Assessment Tax Assessment Total Assessment is a certain percentage of the fair market value that is determined by local assessors to be the total taxable value of land and additions on the property. | Land | Improvement |
|---|---|---|---|---|
| 2024 | $23,310 | $305,000 | $121,300 | $183,700 |
| 2023 | $23,310 | $305,000 | $121,300 | $183,700 |
| 2022 | $23,056 | $305,000 | $121,300 | $183,700 |
| 2021 | $23,056 | $305,000 | $121,300 | $183,700 |
| 2020 | $22,866 | $305,000 | $121,300 | $183,700 |
| 2019 | $22,436 | $305,000 | $121,300 | $183,700 |
| 2018 | $22,436 | $305,000 | $121,300 | $183,700 |
| 2017 | $20,973 | $305,000 | $121,300 | $183,700 |
| 2016 | $21,847 | $313,600 | $121,300 | $192,300 |
| 2015 | -- | $313,600 | $121,300 | $192,300 |
| 2014 | -- | $313,600 | $121,300 | $192,300 |
Source: Public Records
Map
Nearby Homes
- 7 Southpark Dr
- 2 Mcgovern Dr
- 4 Suffern Place
- 20 Madison Ave
- 21 Donaldson Ln
- 20 Main St Unit 39
- 20 Main St Unit 20
- 20 Main St Unit 9
- 33 de Halve Maen Dr
- 50 Major Andre Dr
- 21 Bridge St
- 21 Capt Shankey Dr
- 2 Ridge St
- 6 Hemlock Ln
- 33 Easton St
- 28 Hewitt St
- 12 Sand St
- 46 Jones Dr
- 70 Suffern Ln
- 67 Capt Shankey Dr
- 9 Southpark Dr
- 15 Southpark Dr
- 16 Centennial Dr
- 14 Centennial Dr
- 12 Centennial Dr
- 18 Centennial Dr
- 17 Southpark Dr
- 2 Northpark Dr
- 1 Northpark Dr
- 20 Centennial Dr
- 10 Centennial Dr
- 2 Eastpark Ct
- 6 Southpark Dr
- 5 Southpark Dr
- 12 Southpark Dr
- 3 Northpark Dr
- 14 Southpark Dr
- 11 Centennial Dr
- 8 Centennial Dr
- 9 Centennial Dr