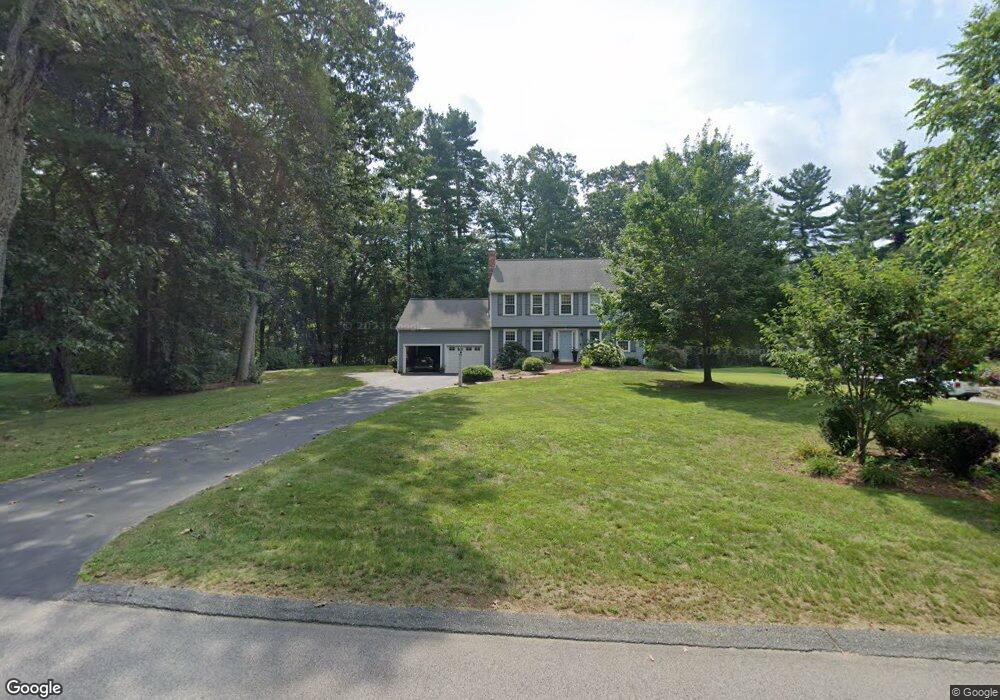
11 Stallbrook Rd Medway, MA 02053
Estimated Value: $658,000 - $1,073,000
4
Beds
3
Baths
1,958
Sq Ft
$419/Sq Ft
Est. Value
About This Home
This home is located at 11 Stallbrook Rd, Medway, MA 02053 and is currently estimated at $820,871, approximately $419 per square foot. 11 Stallbrook Rd is a home located in Norfolk County with nearby schools including John D. McGovern Elementary School, Burke-Memorial Elementary, and Medway Middle School.
Ownership History
Date
Name
Owned For
Owner Type
Purchase Details
Closed on
Jul 11, 1994
Sold by
Niden George and Niden Susan G
Bought by
Frederick Roland W and Frederick Mary E
Current Estimated Value
Home Financials for this Owner
Home Financials are based on the most recent Mortgage that was taken out on this home.
Original Mortgage
$191,900
Interest Rate
8.51%
Mortgage Type
Purchase Money Mortgage
Create a Home Valuation Report for This Property
The Home Valuation Report is an in-depth analysis detailing your home's value as well as a comparison with similar homes in the area
Home Values in the Area
Average Home Value in this Area
Purchase History
| Date | Buyer | Sale Price | Title Company |
|---|---|---|---|
| Frederick Roland W | $239,000 | -- |
Source: Public Records
Mortgage History
| Date | Status | Borrower | Loan Amount |
|---|---|---|---|
| Open | Frederick Roland W | $95,000 | |
| Open | Frederick Roland W | $190,400 | |
| Closed | Frederick Roland W | $191,900 |
Source: Public Records
Tax History Compared to Growth
Tax History
| Year | Tax Paid | Tax Assessment Tax Assessment Total Assessment is a certain percentage of the fair market value that is determined by local assessors to be the total taxable value of land and additions on the property. | Land | Improvement |
|---|---|---|---|---|
| 2025 | $9,502 | $666,800 | $310,600 | $356,200 |
| 2024 | $9,602 | $666,800 | $310,600 | $356,200 |
| 2023 | $9,502 | $596,100 | $282,800 | $313,300 |
| 2022 | $8,721 | $515,100 | $209,100 | $306,000 |
| 2021 | $8,662 | $496,100 | $195,100 | $301,000 |
| 2020 | $7,809 | $446,200 | $195,100 | $251,100 |
| 2019 | $7,372 | $434,400 | $187,200 | $247,200 |
| 2018 | $7,424 | $420,400 | $179,200 | $241,200 |
| 2017 | $7,577 | $422,800 | $184,500 | $238,300 |
| 2016 | $7,391 | $408,100 | $169,800 | $238,300 |
| 2015 | $7,329 | $401,800 | $167,700 | $234,100 |
| 2014 | $7,293 | $387,100 | $167,700 | $219,400 |
Source: Public Records
Map
Nearby Homes
- 22 Granite St
- 9 Tulip Way
- 6 Rainbow Dr
- 39 West St
- 0 Old Log Lane (Farm St) Unit 73416329
- 4 Deerfield Rd
- 462 Hartford Ave
- 387 Hartford Ave
- 78 Fisher St
- 455 Hartford Ave
- 85 Fisher St
- 29 Rawson Rd
- 48 Black Bear Cir Unit 48
- 43 Black Bear Cir Unit 43
- 11 Black Bear Unit 11
- 9 Black Bear Cir Unit 9
- 7 Black Bear Unit 7
- 3 Black Bear Cir Unit 3
- 10 Black Bear Unit 10
- 6 Freedom Trail