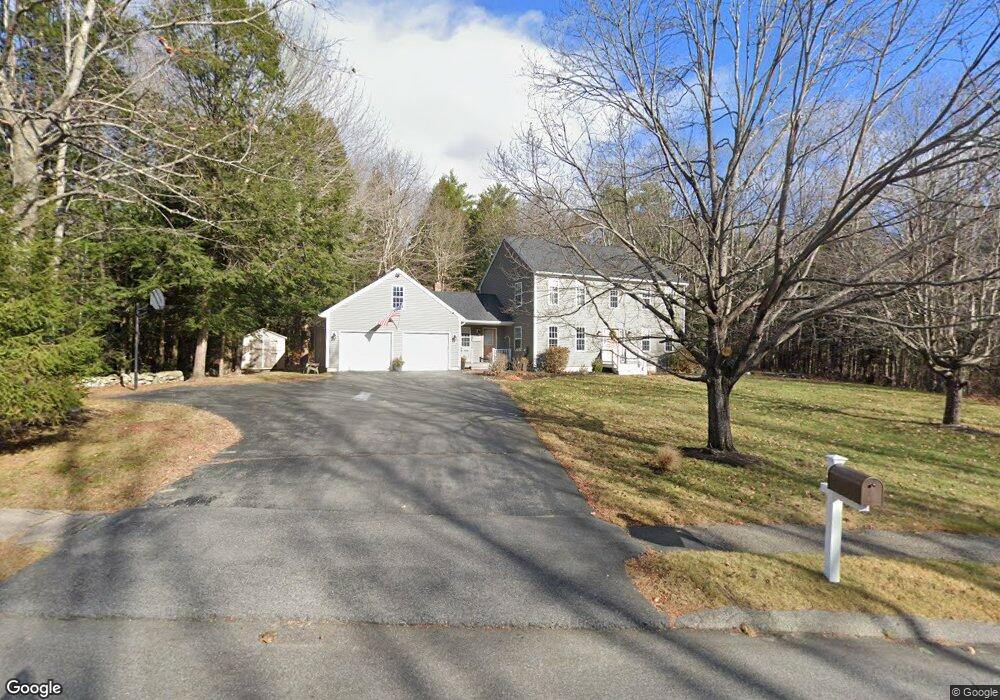
11 Stone Brook Rd Windham, ME 04062
Estimated Value: $602,000 - $664,000
4
Beds
3
Baths
2,212
Sq Ft
$288/Sq Ft
Est. Value
About This Home
This home is located at 11 Stone Brook Rd, Windham, ME 04062 and is currently estimated at $637,696, approximately $288 per square foot. 11 Stone Brook Rd is a home located in Cumberland County with nearby schools including Windham Primary School, Manchester School, and Windham Middle School.
Ownership History
Date
Name
Owned For
Owner Type
Purchase Details
Closed on
Dec 4, 2017
Sold by
Parent Donald G and Parent Doris G
Bought by
Pierce Katie and Pierce Brian
Current Estimated Value
Home Financials for this Owner
Home Financials are based on the most recent Mortgage that was taken out on this home.
Original Mortgage
$315,153
Outstanding Balance
$261,767
Interest Rate
3.88%
Mortgage Type
New Conventional
Estimated Equity
$375,929
Create a Home Valuation Report for This Property
The Home Valuation Report is an in-depth analysis detailing your home's value as well as a comparison with similar homes in the area
Home Values in the Area
Average Home Value in this Area
Purchase History
| Date | Buyer | Sale Price | Title Company |
|---|---|---|---|
| Pierce Katie | -- | -- |
Source: Public Records
Mortgage History
| Date | Status | Borrower | Loan Amount |
|---|---|---|---|
| Open | Pierce Katie | $315,153 |
Source: Public Records
Tax History
| Year | Tax Paid | Tax Assessment Tax Assessment Total Assessment is a certain percentage of the fair market value that is determined by local assessors to be the total taxable value of land and additions on the property. | Land | Improvement |
|---|---|---|---|---|
| 2025 | $6,773 | $561,600 | $147,400 | $414,200 |
| 2024 | $6,442 | $561,600 | $147,400 | $414,200 |
| 2023 | $5,972 | $533,200 | $137,100 | $396,100 |
| 2022 | $5,310 | $457,400 | $109,600 | $347,800 |
| 2021 | $4,697 | $372,800 | $84,100 | $288,700 |
| 2020 | $4,949 | $329,900 | $79,900 | $250,000 |
| 2019 | $4,830 | $329,900 | $79,900 | $250,000 |
| 2018 | $4,641 | $305,700 | $74,100 | $231,600 |
| 2017 | $4,632 | $281,900 | $66,300 | $215,600 |
| 2016 | $4,187 | $266,700 | $66,300 | $200,400 |
| 2015 | $4,041 | $266,700 | $66,300 | $200,400 |
| 2014 | $3,766 | $266,700 | $66,300 | $200,400 |
| 2013 | -- | $266,700 | $66,300 | $200,400 |
Source: Public Records
Map
Nearby Homes
- 4 Patriot Dr
- 4 Hayfield Ln
- 7 Birdsong Ln
- 16 Davis Ave
- 324 Roosevelt Trail
- 53 Johnson Rd
- 17 Inland Farm Rd
- 7 Magnolia Ln Unit 2
- 000 Falmouth Rd
- 20 Babbidge Rd
- 20 Revolution Dr
- 448 Blackstrap Rd
- 440 Blackstrap Rd
- 1 Daybreak Ln Unit 1
- 7 Daybreak Ln Unit 3
- 25 Driftwood Ln Unit 20
- 4 Daybreak Ln Unit 19
- 18 Daybreak Ln Unit 13
- 10 Land of Nod Rd
- 23 Daybreak Ln Unit 23
- 11 Stonebrook Estate
- 11 Stonebrook Rd
- 15 Stone Brook Rd
- 15 Stonebrook Rd
- 0 Stonebrook Rd
- 7 Stone Brook Rd
- 7 Stonebrook Rd
- 14 Fox Run
- 138 Albion Rd
- 18 Stone Brook Rd
- 10 Stone Brook Rd
- 10 Stone Brook Rd
- 14 Stone Brook Rd
- 3 Stone Brook Rd
- 19 Stonebrook Rd
- 18 Fox Run
- 12 Stonebrook Estates
- 19 Stone Brook Rd
- 6 Stone Brook Rd
- 22 Stone Brook Rd
Your Personal Tour Guide
Ask me questions while you tour the home.