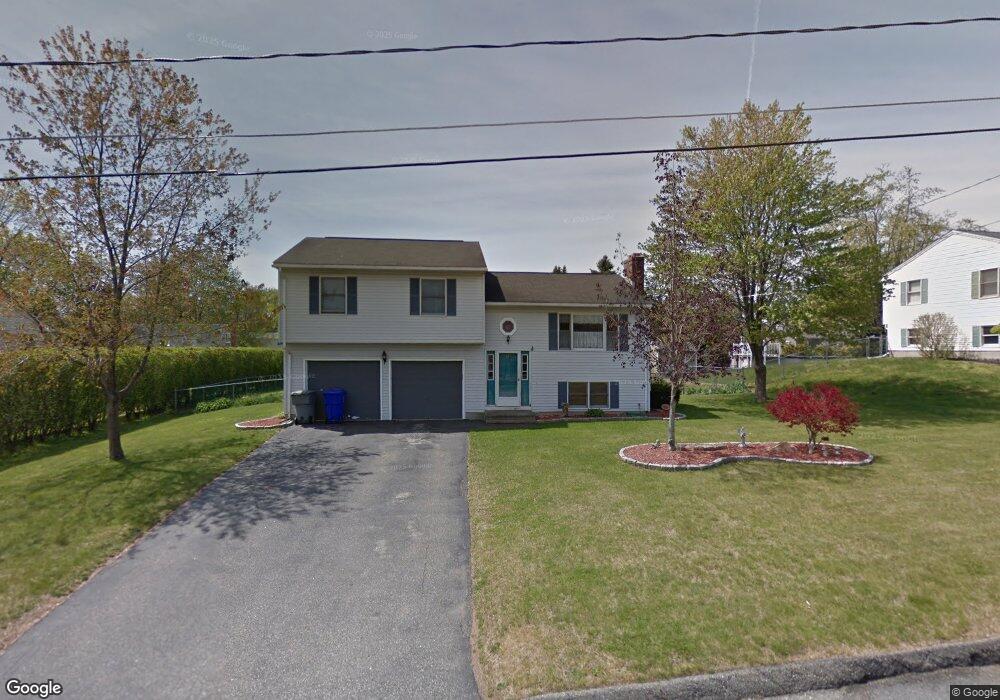
11 Teach St Enfield, CT 06082
Estimated Value: $343,000 - $360,000
3
Beds
2
Baths
1,152
Sq Ft
$306/Sq Ft
Est. Value
About This Home
This home is located at 11 Teach St, Enfield, CT 06082 and is currently estimated at $352,598, approximately $306 per square foot. 11 Teach St is a home located in Hartford County with nearby schools including Edgar H. Parkman School, Nathan Hale Elementary School, and Enfield High School.
Ownership History
Date
Name
Owned For
Owner Type
Purchase Details
Closed on
May 1, 2000
Sold by
Department Of Housing & Urban Dev
Bought by
Cekala Adam and Cekala Magdalena
Current Estimated Value
Purchase Details
Closed on
Jul 10, 1993
Sold by
Lanz Scott
Bought by
Major Roger and Major Christine
Purchase Details
Closed on
Aug 7, 1987
Sold by
Mascor Builders
Bought by
Lanz Todd
Create a Home Valuation Report for This Property
The Home Valuation Report is an in-depth analysis detailing your home's value as well as a comparison with similar homes in the area
Home Values in the Area
Average Home Value in this Area
Purchase History
| Date | Buyer | Sale Price | Title Company |
|---|---|---|---|
| Cekala Adam | $41,000 | -- | |
| Major Roger | $121,500 | -- | |
| Lanz Todd | $124,900 | -- |
Source: Public Records
Mortgage History
| Date | Status | Borrower | Loan Amount |
|---|---|---|---|
| Open | Lanz Todd | $249,314 | |
| Closed | Lanz Todd | $245,630 | |
| Closed | Lanz Todd | $15,000 |
Source: Public Records
Tax History
| Year | Tax Paid | Tax Assessment Tax Assessment Total Assessment is a certain percentage of the fair market value that is determined by local assessors to be the total taxable value of land and additions on the property. | Land | Improvement |
|---|---|---|---|---|
| 2025 | $5,749 | $164,300 | $56,600 | $107,700 |
| 2024 | $5,594 | $164,300 | $56,600 | $107,700 |
| 2023 | $5,553 | $164,300 | $56,600 | $107,700 |
| 2022 | $5,042 | $164,300 | $56,600 | $107,700 |
| 2021 | $4,841 | $128,990 | $46,890 | $82,100 |
| 2020 | $4,833 | $128,770 | $46,890 | $81,880 |
| 2019 | $4,846 | $128,770 | $46,890 | $81,880 |
| 2018 | $4,764 | $128,770 | $46,890 | $81,880 |
| 2017 | $4,498 | $128,770 | $46,890 | $81,880 |
| 2016 | $4,233 | $123,370 | $46,890 | $76,480 |
| 2015 | $4,101 | $123,370 | $46,890 | $76,480 |
| 2014 | $3,995 | $123,370 | $46,890 | $76,480 |
Source: Public Records
Map
Nearby Homes
Your Personal Tour Guide
Ask me questions while you tour the home.