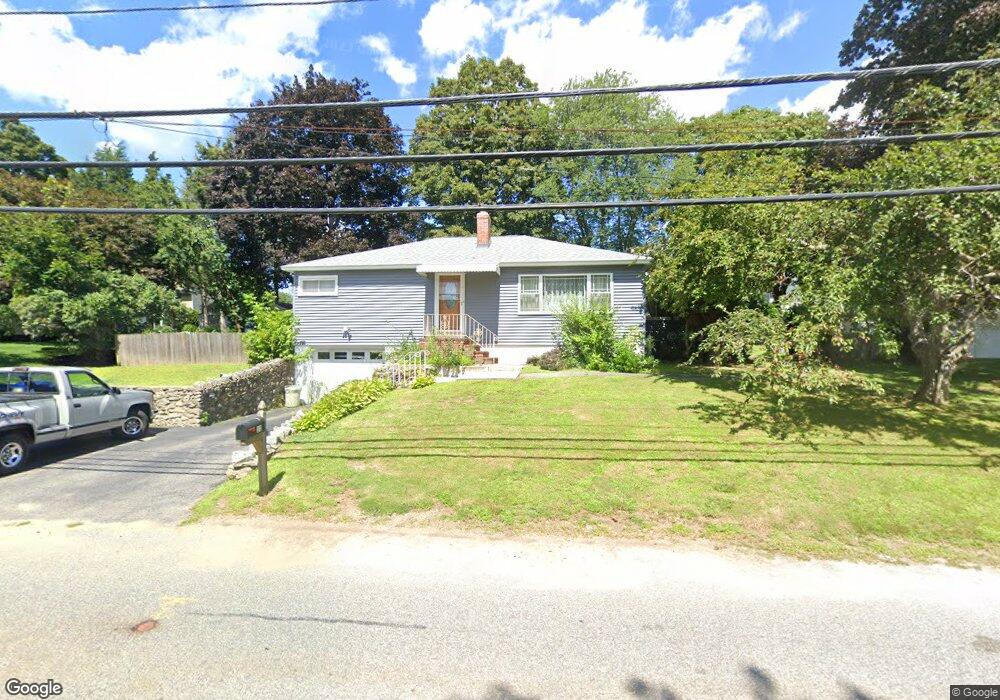
11 Tyler St Methuen, MA 01844
The West End NeighborhoodEstimated Value: $520,000 - $575,000
3
Beds
1
Bath
1,257
Sq Ft
$428/Sq Ft
Est. Value
About This Home
This home is located at 11 Tyler St, Methuen, MA 01844 and is currently estimated at $537,902, approximately $427 per square foot. 11 Tyler St is a home located in Essex County with nearby schools including Marsh Grammar School, Methuen High School, and The Islamic Academy For Peace.
Ownership History
Date
Name
Owned For
Owner Type
Purchase Details
Closed on
Jan 14, 2019
Sold by
Jeanne M Brown Ret
Bought by
Ganey Alexander P
Current Estimated Value
Home Financials for this Owner
Home Financials are based on the most recent Mortgage that was taken out on this home.
Original Mortgage
$499,682
Outstanding Balance
$435,720
Interest Rate
4.4%
Mortgage Type
FHA
Estimated Equity
$102,182
Purchase Details
Closed on
Apr 18, 2012
Sold by
Brown Jeanna M
Bought by
Jeanne M Brown Ret
Purchase Details
Closed on
Jul 19, 2006
Sold by
Bellavance Robert J and Bellavance Nancy J
Bought by
2006 Bellavance Ft and Bellavance
Create a Home Valuation Report for This Property
The Home Valuation Report is an in-depth analysis detailing your home's value as well as a comparison with similar homes in the area
Home Values in the Area
Average Home Value in this Area
Purchase History
| Date | Buyer | Sale Price | Title Company |
|---|---|---|---|
| Ganey Alexander P | $508,900 | -- | |
| Jeanne M Brown Ret | -- | -- | |
| 2006 Bellavance Ft | -- | -- | |
| 2006 Bellavance Ft | -- | -- |
Source: Public Records
Mortgage History
| Date | Status | Borrower | Loan Amount |
|---|---|---|---|
| Open | Ganey Alexander P | $499,682 | |
| Previous Owner | 2006 Bellavance Ft | $40,000 | |
| Previous Owner | 2006 Bellavance Ft | $50,000 | |
| Previous Owner | 2006 Bellavance Ft | $25,000 |
Source: Public Records
Tax History
| Year | Tax Paid | Tax Assessment Tax Assessment Total Assessment is a certain percentage of the fair market value that is determined by local assessors to be the total taxable value of land and additions on the property. | Land | Improvement |
|---|---|---|---|---|
| 2025 | $4,728 | $446,900 | $215,100 | $231,800 |
| 2024 | $4,642 | $427,400 | $195,600 | $231,800 |
| 2023 | $4,390 | $375,200 | $174,600 | $200,600 |
| 2022 | $4,120 | $315,700 | $139,700 | $176,000 |
| 2021 | $3,859 | $292,600 | $132,700 | $159,900 |
| 2020 | $3,851 | $286,500 | $132,700 | $153,800 |
| 2019 | $3,682 | $259,500 | $125,700 | $133,800 |
| 2018 | $3,509 | $252,200 | $125,700 | $126,500 |
| 2017 | $3,495 | $238,600 | $125,700 | $112,900 |
| 2016 | $3,442 | $232,400 | $125,700 | $106,700 |
Source: Public Records
Map
Nearby Homes
Your Personal Tour Guide
Ask me questions while you tour the home.