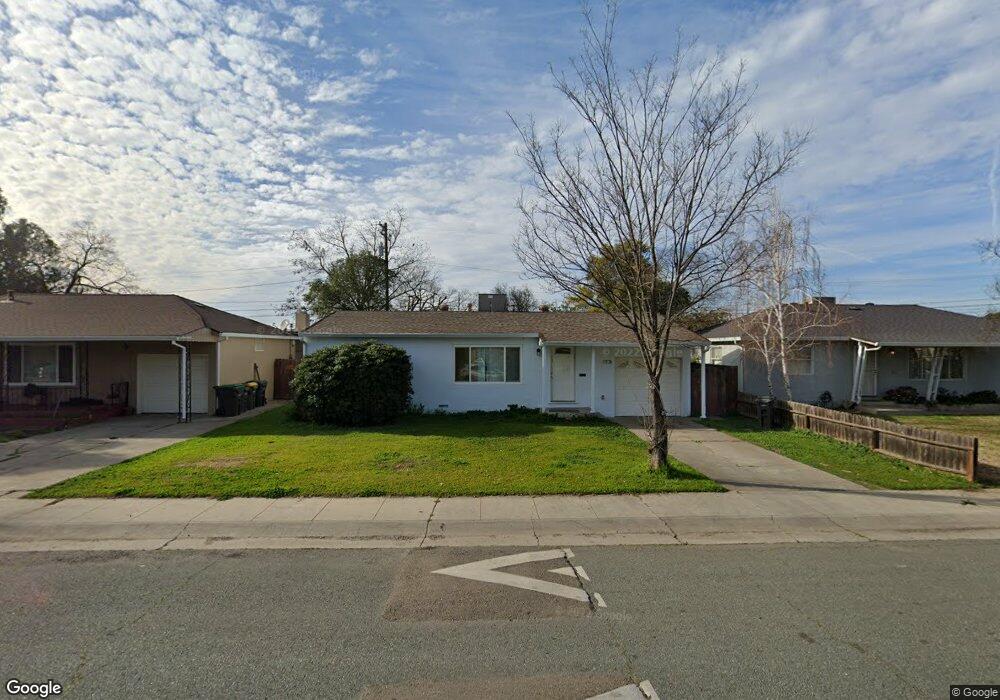
11 W Ingram St Stockton, CA 95204
Midtown NeighborhoodEstimated Value: $272,000 - $377,000
2
Beds
1
Bath
858
Sq Ft
$391/Sq Ft
Est. Value
About This Home
This home is located at 11 W Ingram St, Stockton, CA 95204 and is currently estimated at $335,673, approximately $391 per square foot. 11 W Ingram St is a home located in San Joaquin County with nearby schools including Cleveland Elementary School, Wilson Elementary School, and El Dorado Elementary School.
Ownership History
Date
Name
Owned For
Owner Type
Purchase Details
Closed on
Oct 10, 2014
Sold by
Garcia Eugenio
Bought by
Feng Theresa
Current Estimated Value
Home Financials for this Owner
Home Financials are based on the most recent Mortgage that was taken out on this home.
Original Mortgage
$90,000
Outstanding Balance
$68,947
Interest Rate
4.08%
Mortgage Type
New Conventional
Estimated Equity
$266,726
Purchase Details
Closed on
May 24, 2013
Sold by
Garcia Catalina L
Bought by
Garcia Eugenio
Purchase Details
Closed on
Sep 5, 2008
Sold by
Wells Fargo Bank Na
Bought by
Garcia Eugenio and Garcia Catalina L
Purchase Details
Closed on
Jun 5, 2008
Sold by
Mead Cynthia Ellen
Bought by
Wells Fargo Bank N A and Option One Mortgage Loan Trust 2007-Cp1
Purchase Details
Closed on
May 2, 2001
Sold by
Mead Cynthia and Mead Brenda
Bought by
Mead Cynthia Ellen
Home Financials for this Owner
Home Financials are based on the most recent Mortgage that was taken out on this home.
Original Mortgage
$40,000
Interest Rate
11.99%
Create a Home Valuation Report for This Property
The Home Valuation Report is an in-depth analysis detailing your home's value as well as a comparison with similar homes in the area
Home Values in the Area
Average Home Value in this Area
Purchase History
| Date | Buyer | Sale Price | Title Company |
|---|---|---|---|
| Feng Theresa | $120,000 | First American Title Company | |
| Garcia Eugenio | -- | None Available | |
| Garcia Eugenio | $66,500 | None Available | |
| Wells Fargo Bank N A | $156,408 | None Available | |
| Wells Fargo Bank Na | $156,408 | None Available | |
| Mead Cynthia Ellen | -- | Fidelity National Title Co |
Source: Public Records
Mortgage History
| Date | Status | Borrower | Loan Amount |
|---|---|---|---|
| Open | Feng Theresa | $90,000 | |
| Previous Owner | Mead Cynthia Ellen | $40,000 |
Source: Public Records
Tax History Compared to Growth
Tax History
| Year | Tax Paid | Tax Assessment Tax Assessment Total Assessment is a certain percentage of the fair market value that is determined by local assessors to be the total taxable value of land and additions on the property. | Land | Improvement |
|---|---|---|---|---|
| 2025 | $1,813 | $144,213 | $48,070 | $96,143 |
| 2024 | $1,785 | $141,386 | $47,128 | $94,258 |
| 2023 | $1,745 | $138,614 | $46,204 | $92,410 |
| 2022 | $1,706 | $135,898 | $45,299 | $90,599 |
| 2021 | $1,639 | $133,234 | $44,411 | $88,823 |
| 2020 | $1,671 | $131,869 | $43,956 | $87,913 |
| 2019 | $1,664 | $129,285 | $43,095 | $86,190 |
| 2018 | $1,634 | $126,750 | $42,250 | $84,500 |
| 2017 | $1,548 | $124,266 | $41,422 | $82,844 |
| 2016 | $1,576 | $121,830 | $40,610 | $81,220 |
| 2014 | $902 | $69,857 | $36,767 | $33,090 |
Source: Public Records
Map
Nearby Homes
- 328 Northbank Ct Unit 32
- 4401 Bidwell Place
- 320 W Bianchi Rd
- 222 Carson Place
- 95 W Downs St
- 228 Carson Place
- 78 W Downs St
- 4332 Pacific Ave Unit 42
- 4332 Pacific Ave Unit 65
- 4332 Pacific Ave Unit 38
- 51 W Barrymore St
- 239 E Harper St Unit 6
- 217 W Essex St
- 40 E Atlee St
- 270 E Downs St
- 283 E Churchill St
- 190 W Mckenzie Ave
- 760 Podesto Rd
- 423 E Churchill St
- 503 E Essex St
- 7 W Ingram St Unit 3
- 15 W Ingram St
- 19 W Ingram St Unit 3
- 14 W Ingram St
- 10 W Ingram St
- 25 W Ingram St
- 3 W Ingram St
- 2 E Harper St
- 20 W Ingram St
- 31 W Ingram St Unit 3
- 7 E Ingram St
- 15 W Gibson St
- 3 E Harper St
- 4 E Harper St
- 35 W Ingram St
- 5 W Gibson St
- 9 E Ingram St
- 46 W Gibson St
- 36 W Gibson St
- 3 E Gibson St