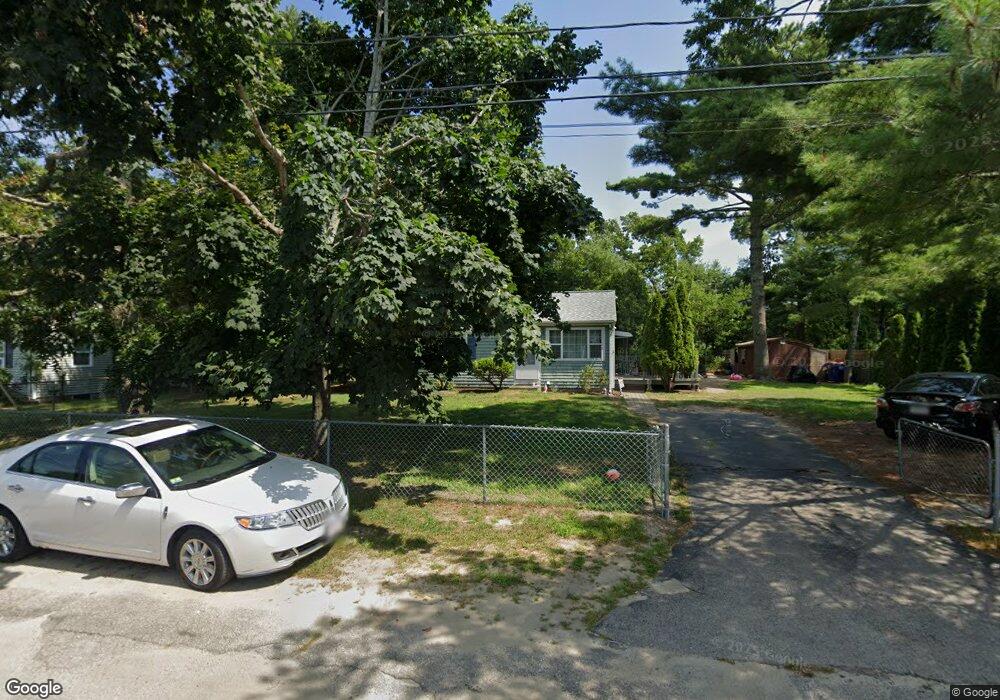
11 Willard St Wareham, MA 02571
Estimated Value: $433,181 - $451,000
About This Home
This home is located at 11 Willard St, Wareham, MA 02571 and is currently estimated at $443,795, approximately $513 per square foot. 11 Willard St is a home located in Plymouth County.
Ownership History
We collect this data history from publicly available records. To have your information removed, we recommend requesting removal directly through your county’s website.
Purchase Details
Purchase Details
Home Financials for this Owner
Home Financials are based on the most recent Mortgage that was taken out on this home.Purchase History
We collect this data history from publicly available records. To have your information removed, we recommend requesting removal directly through your county’s website.
| Date | Buyer | Sale Price | Title Company |
|---|---|---|---|
| -- | None Available | ||
| -- | None Available | ||
| $242,500 | -- | ||
| $242,500 | -- |
Mortgage History
We collect this data history from publicly available records. To have your information removed, we recommend requesting removal directly through your county’s website.
| Date | Status | Borrower | Loan Amount |
|---|---|---|---|
| Previous Owner | $192,500 | ||
| Previous Owner | $60,000 | ||
| Previous Owner | $15,000 |
Tax History
We collect this data history from publicly available records. To have your information removed, we recommend requesting removal directly through your county’s website.
| Year | Tax Paid | Tax Assessment Tax Assessment Total Assessment is a certain percentage of the fair market value that is determined by local assessors to be the total taxable value of land and additions on the property. | Land | Improvement |
|---|---|---|---|---|
| 2025 | $3,745 | $359,400 | $120,800 | $238,600 |
| 2024 | $3,807 | $339,000 | $94,400 | $244,600 |
| 2023 | $3,493 | $305,300 | $85,800 | $219,500 |
| 2022 | $3,493 | $265,000 | $85,800 | $179,200 |
| 2021 | $3,462 | $257,400 | $85,800 | $171,600 |
| 2020 | $3,247 | $244,900 | $85,800 | $159,100 |
| 2019 | $2,851 | $214,500 | $82,500 | $132,000 |
| 2018 | $2,697 | $197,900 | $82,500 | $115,400 |
| 2017 | $2,558 | $190,200 | $82,500 | $107,700 |
| 2016 | $2,335 | $172,600 | $79,800 | $92,800 |
| 2015 | $2,256 | $172,600 | $79,800 | $92,800 |
| 2014 | $2,185 | $170,000 | $79,800 | $90,200 |
Map
- 2711 Cranberry Hwy
- 2743 Cranberry Hwy Unit 5B
- 2743 Cranberry Hwy Unit 13B
- 2743 Cranberry Hwy Unit 17B
- 2743 Cranberry Hwy Unit 17B
- 4 Wren Terrace
- 2645 Cranberry Hwy Unit A
- 73 Kimberly Ct
- 6 Gilbert Way
- 2783 Cranberry Hwy
- 2795 Cranberry Hwy
- 0 Charge Pond Rd
- 2614 Cranberry Hwy
- 66 Mayflower Ridge Dr
- 28 Indian Neck Rd
- 30 Minot Ave
- 7 Indian Neck Rd
- 2838 Cranberry Hwy
- 38 Agawam Lake Shore Dr
- 15 Oakhill Rd
Ask me questions while you tour the home.