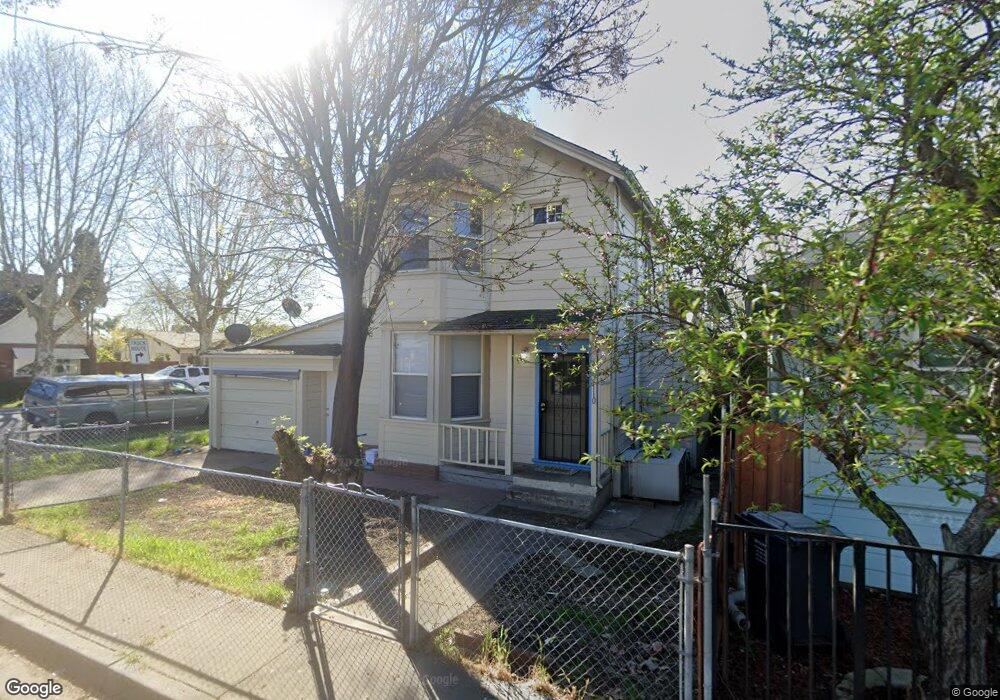
110 3rd St Isleton, CA 95641
Estimated Value: $316,000 - $390,000
3
Beds
2
Baths
1,376
Sq Ft
$255/Sq Ft
Est. Value
About This Home
This home is located at 110 3rd St, Isleton, CA 95641 and is currently estimated at $351,336, approximately $255 per square foot. 110 3rd St is a home with nearby schools including Isleton Elementary School, Riverview Middle School, and Rio Vista High School.
Ownership History
Date
Name
Owned For
Owner Type
Purchase Details
Closed on
Aug 19, 2013
Sold by
Lowe Bark Hong and Low Ying Yi Yang
Bought by
Low Bark Hong and Revocab Ying
Current Estimated Value
Purchase Details
Closed on
Sep 15, 2005
Sold by
Wilson Ella L
Bought by
Low Bark Hong and Low Ying Yi Yang
Home Financials for this Owner
Home Financials are based on the most recent Mortgage that was taken out on this home.
Original Mortgage
$150,000
Outstanding Balance
$80,049
Interest Rate
5.81%
Mortgage Type
Fannie Mae Freddie Mac
Estimated Equity
$271,287
Purchase Details
Closed on
May 7, 1996
Sold by
Wilson Ella L
Bought by
Wilson Ella L
Create a Home Valuation Report for This Property
The Home Valuation Report is an in-depth analysis detailing your home's value as well as a comparison with similar homes in the area
Purchase History
| Date | Buyer | Sale Price | Title Company |
|---|---|---|---|
| Low Bark Hong | -- | None Available | |
| Low Bark Hong | $200,000 | Alliance Title Company | |
| Wilson Ella L | -- | -- |
Source: Public Records
Mortgage History
| Date | Status | Borrower | Loan Amount |
|---|---|---|---|
| Open | Low Bark Hong | $150,000 |
Source: Public Records
Tax History
| Year | Tax Paid | Tax Assessment Tax Assessment Total Assessment is a certain percentage of the fair market value that is determined by local assessors to be the total taxable value of land and additions on the property. | Land | Improvement |
|---|---|---|---|---|
| 2025 | $2,897 | $273,298 | $54,652 | $218,646 |
| 2024 | $2,897 | $267,940 | $53,581 | $214,359 |
| 2023 | $3,008 | $262,687 | $52,531 | $210,156 |
| 2022 | $2,839 | $257,537 | $51,501 | $206,036 |
| 2021 | $2,589 | $236,249 | $59,062 | $177,187 |
| 2020 | $2,234 | $210,000 | $52,500 | $157,500 |
| 2019 | $2,090 | $200,000 | $50,000 | $150,000 |
| 2018 | $1,703 | $155,000 | $35,000 | $120,000 |
| 2017 | $1,405 | $130,548 | $32,636 | $97,912 |
| 2016 | $1,296 | $119,770 | $29,942 | $89,828 |
| 2015 | $1,234 | $111,936 | $27,984 | $83,952 |
| 2014 | $1,179 | $105,600 | $26,400 | $79,200 |
Source: Public Records
Map
Nearby Homes
- 0 California 160
- 301 B St
- 9 4th Ave
- 330 Jackson Boulevard Extension
- 25 4th Ave
- 30 3rd Ave
- 608 Union St
- 612 Union St
- 00 Brannan Isle Rd
- 414 F St
- 39 Main St
- 0 6th St
- 0 6th St
- 58 Main St
- 706 Anne Marie Way
- 525 Brannan Isle
- 16637 Tyler Island Rd
- 665 W Tyler Island Bridge Rd
- 16073 Totem Dr
- 1777 Circle Dr
Your Personal Tour Guide
Ask me questions while you tour the home.