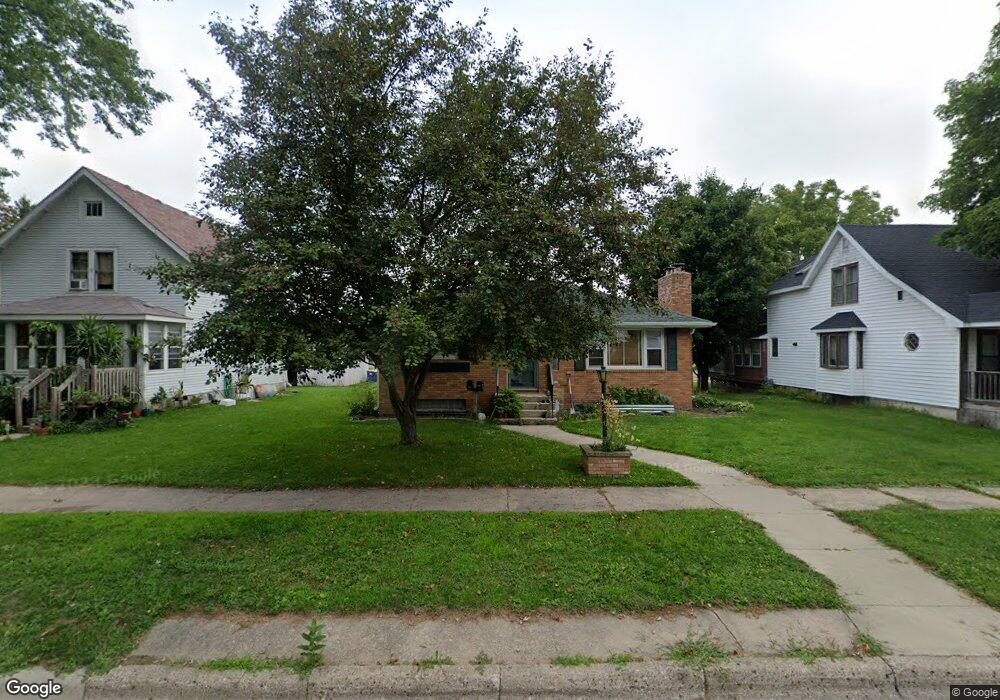
110 4th St Kenyon, MN 55946
Estimated Value: $164,000 - $296,000
6
Beds
3
Baths
2,450
Sq Ft
$105/Sq Ft
Est. Value
About This Home
This home is located at 110 4th St, Kenyon, MN 55946 and is currently estimated at $256,754, approximately $104 per square foot. 110 4th St is a home located in Goodhue County with nearby schools including Kenyon-Wanamingo Elementary School, Kenyon-Wanamingo Middle School, and Kenyon-Wanamingo Senior High School.
Ownership History
Date
Name
Owned For
Owner Type
Purchase Details
Closed on
Aug 4, 2020
Sold by
Skok Brian J and Skok Debora
Bought by
Barsness Molly
Current Estimated Value
Home Financials for this Owner
Home Financials are based on the most recent Mortgage that was taken out on this home.
Original Mortgage
$204,232
Interest Rate
2.9%
Mortgage Type
FHA
Purchase Details
Closed on
Oct 10, 1997
Sold by
Germundson Ruth L
Bought by
Skok Kenneth M
Create a Home Valuation Report for This Property
The Home Valuation Report is an in-depth analysis detailing your home's value as well as a comparison with similar homes in the area
Purchase History
| Date | Buyer | Sale Price | Title Company |
|---|---|---|---|
| Barsness Molly | $208,000 | Titlesmart Inc | |
| Skok Kenneth M | $70,000 | -- |
Source: Public Records
Mortgage History
| Date | Status | Borrower | Loan Amount |
|---|---|---|---|
| Previous Owner | Barsness Molly | $204,232 | |
| Closed | Skok Kenneth M | -- |
Source: Public Records
Tax History
| Year | Tax Paid | Tax Assessment Tax Assessment Total Assessment is a certain percentage of the fair market value that is determined by local assessors to be the total taxable value of land and additions on the property. | Land | Improvement |
|---|---|---|---|---|
| 2025 | $3,700 | $269,800 | $37,400 | $232,400 |
| 2024 | $3,700 | $263,600 | $37,400 | $226,200 |
| 2023 | $1,794 | $247,300 | $37,400 | $209,900 |
| 2022 | $3,606 | $243,500 | $37,400 | $206,100 |
| 2021 | $3,288 | $216,000 | $34,100 | $181,900 |
| 2020 | $3,304 | $213,000 | $34,100 | $178,900 |
| 2019 | $2,862 | $214,700 | $34,100 | $180,600 |
| 2018 | $2,130 | $177,600 | $22,800 | $154,800 |
| 2017 | $1,962 | $141,800 | $17,500 | $124,300 |
| 2016 | $1,748 | $134,000 | $17,500 | $116,500 |
| 2015 | $1,720 | $122,100 | $17,500 | $104,600 |
| 2014 | -- | $129,400 | $15,000 | $114,400 |
Source: Public Records
Map
Nearby Homes
Your Personal Tour Guide
Ask me questions while you tour the home.