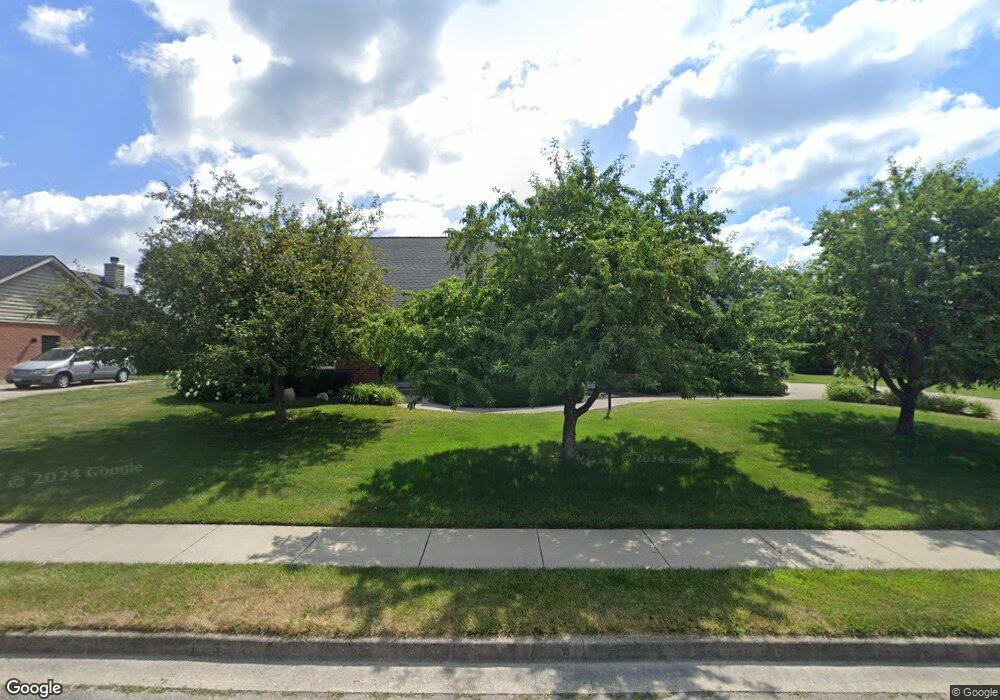
110 Crosby St Covington, OH 45318
Estimated Value: $313,813 - $363,000
4
Beds
2
Baths
1,976
Sq Ft
$170/Sq Ft
Est. Value
About This Home
This home is located at 110 Crosby St, Covington, OH 45318 and is currently estimated at $336,703, approximately $170 per square foot. 110 Crosby St is a home located in Miami County with nearby schools including Covington Elementary/Junior High School, Covington Junior High School, and Covington High School.
Ownership History
Date
Name
Owned For
Owner Type
Purchase Details
Closed on
Jun 22, 2017
Sold by
Rapp Wayne E
Bought by
Wayne E Rapp
Current Estimated Value
Home Financials for this Owner
Home Financials are based on the most recent Mortgage that was taken out on this home.
Interest Rate
3.9%
Purchase Details
Closed on
Jun 30, 2004
Sold by
Mckinley Kevin L and Mckinley Vicky L
Bought by
Rapp Wayne E and Rapp Ava M
Purchase Details
Closed on
Nov 14, 2003
Sold by
New Tech Properties
Bought by
Mckinley Kevin L and Mckinley Vicky L
Create a Home Valuation Report for This Property
The Home Valuation Report is an in-depth analysis detailing your home's value as well as a comparison with similar homes in the area
Home Values in the Area
Average Home Value in this Area
Purchase History
| Date | Buyer | Sale Price | Title Company |
|---|---|---|---|
| Wayne E Rapp | -- | -- | |
| Rapp Wayne E | $37,000 | -- | |
| Mckinley Kevin L | $36,500 | -- |
Source: Public Records
Mortgage History
| Date | Status | Borrower | Loan Amount |
|---|---|---|---|
| Closed | Mckinley Kevin L | -- |
Source: Public Records
Tax History
| Year | Tax Paid | Tax Assessment Tax Assessment Total Assessment is a certain percentage of the fair market value that is determined by local assessors to be the total taxable value of land and additions on the property. | Land | Improvement |
|---|---|---|---|---|
| 2025 | $3,356 | $122,750 | $14,560 | $108,190 |
| 2024 | $3,356 | $79,770 | $12,110 | $67,660 |
| 2023 | $2,629 | $79,770 | $12,110 | $67,660 |
| 2022 | $2,660 | $79,770 | $12,110 | $67,660 |
| 2021 | $2,872 | $79,770 | $12,110 | $67,660 |
| 2020 | $2,879 | $79,770 | $12,110 | $67,660 |
| 2019 | $2,892 | $79,770 | $12,110 | $67,660 |
| 2018 | $2,662 | $73,960 | $13,090 | $60,870 |
| 2017 | $2,709 | $73,960 | $13,090 | $60,870 |
| 2016 | $2,675 | $73,960 | $13,090 | $60,870 |
| 2015 | $2,349 | $68,460 | $12,110 | $56,350 |
| 2014 | $2,349 | $68,460 | $12,110 | $56,350 |
| 2013 | $2,582 | $68,460 | $12,110 | $56,350 |
Source: Public Records
Map
Nearby Homes
Your Personal Tour Guide
Ask me questions while you tour the home.