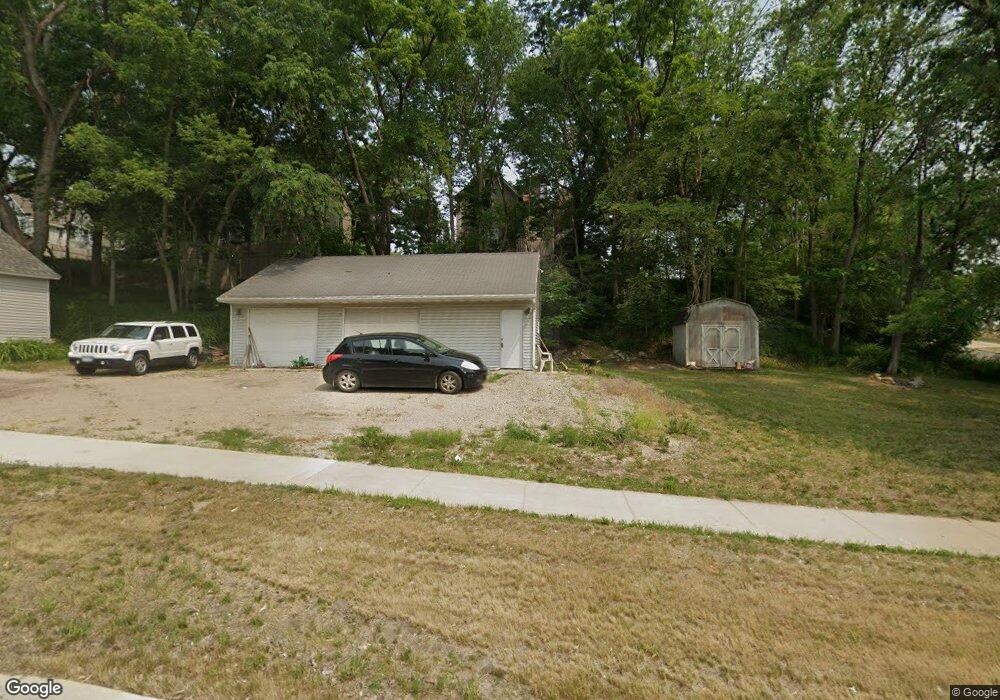
110 Division St W Faribault, MN 55021
Estimated Value: $159,000 - $197,000
1
Bed
1
Bath
950
Sq Ft
$187/Sq Ft
Est. Value
About This Home
This home is located at 110 Division St W, Faribault, MN 55021 and is currently estimated at $177,567, approximately $186 per square foot. 110 Division St W is a home located in Rice County with nearby schools including Roosevelt Elementary School, Faribault Middle School, and Faribault Senior High School.
Ownership History
Date
Name
Owned For
Owner Type
Purchase Details
Closed on
Mar 21, 2022
Sold by
Brinkman Peter L
Bought by
Peter L Brinkman Revocable Trust
Current Estimated Value
Purchase Details
Closed on
May 1, 2009
Sold by
Deutsche Bank National Trust Company
Bought by
Brinkman Peter L
Purchase Details
Closed on
Aug 30, 2001
Sold by
Estate Of Michael Thompson
Bought by
Barsness Aaron
Purchase Details
Closed on
May 28, 1997
Sold by
Thompson Richard R and Thompson Margaret L
Bought by
Thompson Michael P
Create a Home Valuation Report for This Property
The Home Valuation Report is an in-depth analysis detailing your home's value as well as a comparison with similar homes in the area
Home Values in the Area
Average Home Value in this Area
Purchase History
| Date | Buyer | Sale Price | Title Company |
|---|---|---|---|
| Peter L Brinkman Revocable Trust | $500 | None Listed On Document | |
| Brinkman Peter L | $33,000 | -- | |
| Barsness Aaron | $79,000 | -- | |
| Thompson Michael P | $66,250 | -- |
Source: Public Records
Tax History
| Year | Tax Paid | Tax Assessment Tax Assessment Total Assessment is a certain percentage of the fair market value that is determined by local assessors to be the total taxable value of land and additions on the property. | Land | Improvement |
|---|---|---|---|---|
| 2025 | $2,106 | $162,500 | $58,700 | $103,800 |
| 2024 | $2,106 | $135,500 | $55,100 | $80,400 |
| 2023 | $1,870 | $135,500 | $55,100 | $80,400 |
| 2022 | $1,716 | $124,600 | $54,300 | $70,300 |
| 2021 | $1,612 | $103,600 | $43,800 | $59,800 |
| 2020 | $1,574 | $94,100 | $42,000 | $52,100 |
| 2019 | $1,340 | $92,200 | $42,000 | $50,200 |
| 2018 | $1,296 | $71,900 | $25,700 | $46,200 |
| 2017 | $1,354 | $65,900 | $23,400 | $42,500 |
| 2016 | $890 | $65,100 | $23,400 | $41,700 |
| 2015 | $824 | $60,500 | $18,700 | $41,800 |
| 2014 | -- | $58,600 | $18,700 | $39,900 |
Source: Public Records
Map
Nearby Homes
Your Personal Tour Guide
Ask me questions while you tour the home.