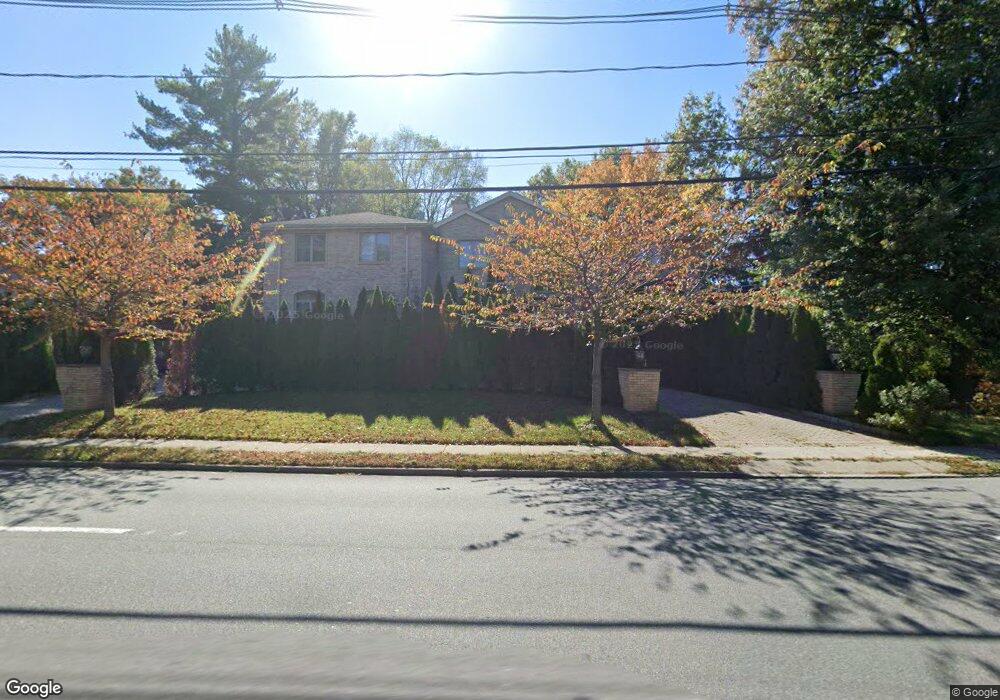
110 E Midland Ave Paramus, NJ 07652
Estimated Value: $1,627,000 - $2,065,000
5
Beds
5
Baths
4,092
Sq Ft
$454/Sq Ft
Est. Value
About This Home
This home is located at 110 E Midland Ave, Paramus, NJ 07652 and is currently estimated at $1,859,278, approximately $454 per square foot. 110 E Midland Ave is a home located in Bergen County with nearby schools including Paramus High School and David Gregory School.
Ownership History
Date
Name
Owned For
Owner Type
Purchase Details
Closed on
Aug 16, 2017
Sold by
Ditech Financial Llc
Bought by
Burucuoglu Fuad and Burucuoglu Thomas
Current Estimated Value
Purchase Details
Closed on
Sep 30, 2008
Home Financials for this Owner
Home Financials are based on the most recent Mortgage that was taken out on this home.
Original Mortgage
$370,000
Interest Rate
6.41%
Mortgage Type
New Conventional
Create a Home Valuation Report for This Property
The Home Valuation Report is an in-depth analysis detailing your home's value as well as a comparison with similar homes in the area
Home Values in the Area
Average Home Value in this Area
Purchase History
| Date | Buyer | Sale Price | Title Company |
|---|---|---|---|
| Burucuoglu Fuad | $357,000 | None Available | |
| -- | -- | -- | |
| Burucuoglu Fuad | -- | -- |
Source: Public Records
Mortgage History
| Date | Status | Borrower | Loan Amount |
|---|---|---|---|
| Previous Owner | Burucuoglu Fuad | $370,000 |
Source: Public Records
Tax History
| Year | Tax Paid | Tax Assessment Tax Assessment Total Assessment is a certain percentage of the fair market value that is determined by local assessors to be the total taxable value of land and additions on the property. | Land | Improvement |
|---|---|---|---|---|
| 2025 | $22,195 | $1,559,300 | $402,700 | $1,156,600 |
| 2024 | $21,692 | $1,466,000 | $372,100 | $1,093,900 |
| 2023 | $20,597 | $1,414,100 | $354,700 | $1,059,400 |
| 2022 | $20,597 | $1,327,100 | $331,800 | $995,300 |
| 2021 | $19,969 | $1,207,300 | $288,500 | $918,800 |
| 2020 | $18,985 | $1,190,300 | $284,200 | $906,100 |
| 2019 | $20,722 | $1,116,500 | $281,600 | $834,900 |
| 2018 | $20,465 | $1,116,500 | $281,600 | $834,900 |
| 2017 | $20,108 | $1,116,500 | $281,600 | $834,900 |
| 2016 | $19,561 | $1,116,500 | $281,600 | $834,900 |
| 2015 | $19,360 | $1,116,500 | $281,600 | $834,900 |
| 2014 | $19,193 | $1,116,500 | $281,600 | $834,900 |
Source: Public Records
Map
Nearby Homes
- 461 Arthur Terrace
- 375 Burnet Place
- 360 Valley View Ave
- 368 Elmwood Dr
- 90 Arnot Place
- 105 Circle Dr
- 121 Circle Dr
- 216 E Midland Ave
- 298 Buttonwood Dr
- 311 N Farview Ave
- 362 Harrison St
- 333 Harrison St
- 6 Merrimack Ct
- 261 Idaho St
- 156 Stuart St
- 277 Columbia Terrace
- 623 Alberta Dr
- 624 West Dr
- 179 Clayton Terrace
- 192 Thomas Dr
- 114 E Midland Ave
- 107 Grant Place
- 103 Grant Place
- 111 Grant Place
- 109 E Midland Ave
- 424 Roedel Place
- 115 E Midland Ave
- 411 Chelsea St
- 99 Grant Place
- 407 Chelsea St
- 108 Grant Place
- 430 Roedel Place
- 421 Yuhas Dr
- 425 Roedel Place
- 112 Grant Place
- 104 Grant Place
- 95 Grant Place
- 401 Chelsea St
- 414 Acorn Dr
- 429 Roedel Place
Your Personal Tour Guide
Ask me questions while you tour the home.