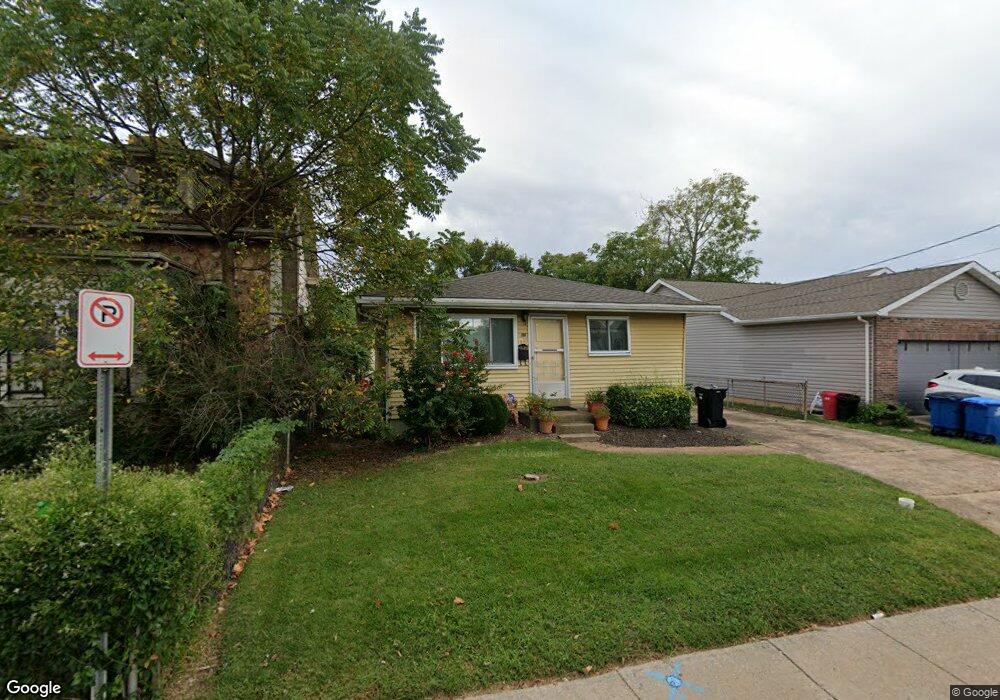
110 E Ripa Ave Saint Louis, MO 63125
Lemay NeighborhoodEstimated Value: $173,000 - $184,000
3
Beds
2
Baths
950
Sq Ft
$187/Sq Ft
Est. Value
About This Home
This home is located at 110 E Ripa Ave, Saint Louis, MO 63125 and is currently estimated at $178,046, approximately $187 per square foot. 110 E Ripa Ave is a home located in St. Louis County with nearby schools including Hancock Place Elementary School, Hancock Place Middle School, and Hancock Place High School.
Ownership History
Date
Name
Owned For
Owner Type
Purchase Details
Closed on
Jan 9, 2025
Sold by
Jackson Russell Emmett
Bought by
Revocable Living Trust Agreement Of Russell E and Jackson
Current Estimated Value
Purchase Details
Closed on
Oct 6, 1998
Sold by
Jackson Russell E
Bought by
Jackson Ronald E and Jackson Stephen M
Create a Home Valuation Report for This Property
The Home Valuation Report is an in-depth analysis detailing your home's value as well as a comparison with similar homes in the area
Home Values in the Area
Average Home Value in this Area
Purchase History
| Date | Buyer | Sale Price | Title Company |
|---|---|---|---|
| Revocable Living Trust Agreement Of Russell E | -- | None Listed On Document | |
| Jackson Ronald E | -- | -- |
Source: Public Records
Tax History
| Year | Tax Paid | Tax Assessment Tax Assessment Total Assessment is a certain percentage of the fair market value that is determined by local assessors to be the total taxable value of land and additions on the property. | Land | Improvement |
|---|---|---|---|---|
| 2025 | $2,305 | $32,700 | $7,830 | $24,870 |
| 2024 | $2,305 | $29,760 | $4,010 | $25,750 |
| 2023 | $2,189 | $29,760 | $4,010 | $25,750 |
| 2022 | $1,778 | $21,850 | $4,520 | $17,330 |
| 2021 | $1,747 | $23,940 | $4,520 | $19,420 |
| 2020 | $1,678 | $20,040 | $4,480 | $15,560 |
| 2019 | $1,674 | $20,040 | $4,480 | $15,560 |
| 2018 | $1,326 | $13,790 | $3,970 | $9,820 |
| 2017 | $1,303 | $13,790 | $3,970 | $9,820 |
| 2016 | $1,352 | $13,800 | $1,750 | $12,050 |
Source: Public Records
Map
Nearby Homes
- 9933 Linn Ave
- 111 E Arlee Ave
- 9704 S Broadway
- 9929 Meadow Ave
- 309 E Arlee Ave
- 223 W Felton Ave
- 9969 Lark Ave
- 504 W Ripa Ave
- 124 W Cartwright Ave
- 9604 Gentry Ave
- 1710 Telegraph Rd
- 121 Mann St
- 9533 Gentry Ave
- 317 Forbes Ave
- 1625 Telegraph Rd
- 1505 Telegraph Rd
- 1656 Herault Place
- 423 Degenhardt Ave
- 1036 Wachtel Ave
- 1660 Blue Ridge Dr Unit G
- 106 E Ripa - To Be Built
- 106 E Ripa Ave
- 112 E Ripa Ave
- 9907 Erie Dr
- 9909 Erie Dr
- 118 E Ripa Ave
- 9900 S Broadway
- 113 E Ripa Ave
- 120 E Ripa Ave
- 117 E Ripa Ave
- 9911 Erie Dr
- 115 E Ripa Ave
- 122 E Ripa Ave
- 9912 S Broadway
- 9854 S Broadway
- 9913 Erie Dr
- 124 E Ripa Ave
- 9916 S Broadway
- 9910 Erie Dr
- 9915 Erie Dr
Your Personal Tour Guide
Ask me questions while you tour the home.