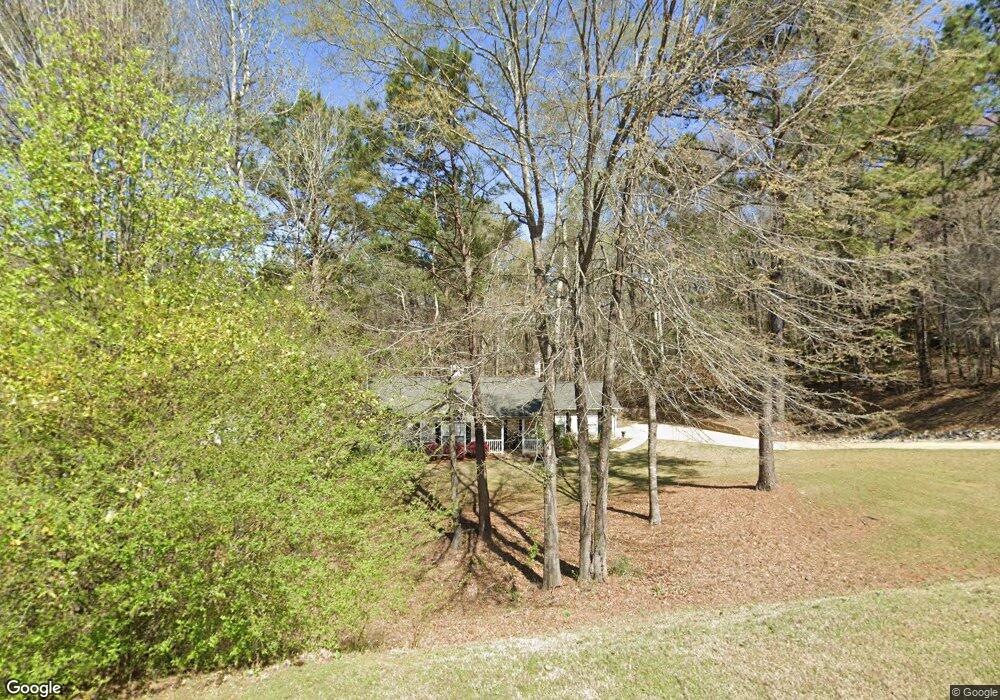
110 Edgemont Dr Unit 113 Lagrange, GA 30240
Estimated Value: $218,000 - $241,701
3
Beds
2
Baths
1,428
Sq Ft
$163/Sq Ft
Est. Value
About This Home
This home is located at 110 Edgemont Dr Unit 113, Lagrange, GA 30240 and is currently estimated at $232,925, approximately $163 per square foot. 110 Edgemont Dr Unit 113 is a home located in Troup County with nearby schools including Hillcrest Elementary School, Franklin Forest Elementary School, and Hollis Hand Elementary School.
Ownership History
Date
Name
Owned For
Owner Type
Purchase Details
Closed on
Aug 6, 2018
Sold by
Ward Tracy
Bought by
Mclain Stephanie and Cole Lillie J
Current Estimated Value
Home Financials for this Owner
Home Financials are based on the most recent Mortgage that was taken out on this home.
Original Mortgage
$89,540
Outstanding Balance
$77,274
Interest Rate
4.5%
Mortgage Type
FHA
Estimated Equity
$155,651
Purchase Details
Closed on
Dec 5, 2014
Sold by
Swindle Demetrius S
Bought by
Ward Tracy
Purchase Details
Closed on
Dec 6, 2004
Sold by
Fowler Barry J
Bought by
Swindle Dementrius S and Swindle Wytincia B
Purchase Details
Closed on
Oct 26, 2004
Sold by
Laura Fowler
Bought by
Fowler Barry J
Purchase Details
Closed on
Jul 13, 1999
Sold by
Dri Lakemont Llc
Bought by
Laura Fowler
Purchase Details
Closed on
Nov 1, 1994
Bought by
Dri Lakemont Llc
Create a Home Valuation Report for This Property
The Home Valuation Report is an in-depth analysis detailing your home's value as well as a comparison with similar homes in the area
Purchase History
| Date | Buyer | Sale Price | Title Company |
|---|---|---|---|
| Mclain Stephanie | $110,000 | -- | |
| Ward Tracy | $79,900 | -- | |
| Swindle Dementrius S | -- | -- | |
| Swindle Wytincia B | $108,000 | -- | |
| Swindle Wytincia B | $108,000 | -- | |
| Fowler Barry J | -- | -- | |
| Laura Fowler | $97,800 | -- | |
| Dri Lakemont Llc | -- | -- |
Source: Public Records
Mortgage History
| Date | Status | Borrower | Loan Amount |
|---|---|---|---|
| Open | Mclain Stephanie | $89,540 |
Source: Public Records
Tax History
| Year | Tax Paid | Tax Assessment Tax Assessment Total Assessment is a certain percentage of the fair market value that is determined by local assessors to be the total taxable value of land and additions on the property. | Land | Improvement |
|---|---|---|---|---|
| 2025 | $2,084 | $85,280 | $14,000 | $71,280 |
| 2024 | $1,745 | $65,960 | $14,000 | $51,960 |
| 2023 | $1,753 | $66,280 | $14,000 | $52,280 |
| 2022 | $1,592 | $59,040 | $10,000 | $49,040 |
| 2021 | $1,330 | $46,080 | $10,000 | $36,080 |
| 2020 | $1,269 | $44,080 | $8,000 | $36,080 |
| 2019 | $1,327 | $49,720 | $6,000 | $43,720 |
| 2018 | $1,163 | $38,560 | $5,200 | $33,360 |
| 2017 | $1,163 | $38,560 | $5,200 | $33,360 |
| 2016 | $1,136 | $37,665 | $5,200 | $32,465 |
| 2015 | $966 | $31,960 | $4,414 | $27,546 |
| 2014 | $944 | $33,168 | $5,200 | $27,968 |
| 2013 | -- | $35,054 | $5,200 | $29,854 |
Source: Public Records
Map
Nearby Homes
- 166 Lakemont Dr
- 107 Edgemont Ct
- 114 Taylor Len Dr
- 143 Taylor Len Dr
- 120 Copper Creek Dr
- 111 Copper Creek Dr
- 135 Copper Creek Dr
- 178 Waterview Dr
- 219 E Yorktown Dr
- 113 Wellington Dr
- 0 Waterview Dr Unit 10558462
- 206 Sturbridge Dr
- 0 River Club Dr Unit 10311961
- 64 Waterview Ct
- 24 N Brooks Rd
- 155 Indian Bend Dr
- 111 Indian Bend Dr
- 65 Indian Bend Dr
- 102 Cameron Pointe Dr
- 116 Firefly Run
- 110 Edgemont Dr
- 112 Edgemont Dr
- 108 Edgemont Dr
- 106 Edgemont Dr
- 149 Edgemont Dr
- 114 Edgemont Dr
- 106 Edgemont Dr
- 151 Edgemont Dr
- 147 Edgemont Dr
- 153 Edgemont Dr
- 167 Lakemont Dr
- 104 Edgemont Dr
- 116 Edgemont Dr
- 165 Lakemont Dr
- 155 Edgemont Dr
- 169 Lakemont Dr
- 145 Edgemont Dr
- 163 Lakemont Dr
- 157 Edgemont Dr
- 118 Edgemont Dr
Your Personal Tour Guide
Ask me questions while you tour the home.