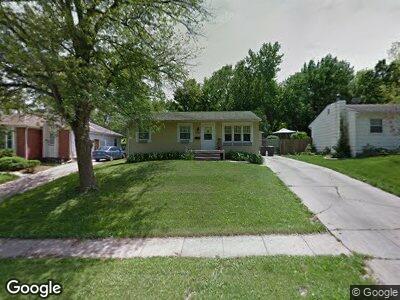
110 Loomis Ave Des Moines, IA 50315
Indianola Hills NeighborhoodEstimated Value: $181,000 - $205,518
3
Beds
1
Bath
864
Sq Ft
$221/Sq Ft
Est. Value
About This Home
This home is located at 110 Loomis Ave, Des Moines, IA 50315 and is currently estimated at $191,130, approximately $221 per square foot. 110 Loomis Ave is a home located in Polk County with nearby schools including Park Avenue Elementary School, Brody Middle School, and Lincoln High School.
Ownership History
Date
Name
Owned For
Owner Type
Purchase Details
Closed on
Nov 14, 2019
Sold by
Roberts Billy and Roberts Theresa
Bought by
Tayal Mukesh
Current Estimated Value
Purchase Details
Closed on
Apr 30, 2018
Sold by
Roberts Billy
Bought by
Roberts Thersa
Purchase Details
Closed on
Jul 3, 2008
Sold by
Huot Karon Celayne and Huot John
Bought by
Roberts Billy and Roberts Theresa
Home Financials for this Owner
Home Financials are based on the most recent Mortgage that was taken out on this home.
Original Mortgage
$105,560
Interest Rate
6.15%
Mortgage Type
FHA
Purchase Details
Closed on
May 16, 2006
Sold by
Huot Karon Celayne and Huot John
Bought by
Roberts Billy L and Roberts Theresa A
Purchase Details
Closed on
Mar 27, 2003
Sold by
Schaffer Lawrence Newell and Schaffer Vickie L
Bought by
Schaffer Vickie L
Purchase Details
Closed on
Mar 26, 2003
Sold by
Schaffer Vickie L
Bought by
Huot Karon Celayne
Create a Home Valuation Report for This Property
The Home Valuation Report is an in-depth analysis detailing your home's value as well as a comparison with similar homes in the area
Home Values in the Area
Average Home Value in this Area
Purchase History
| Date | Buyer | Sale Price | Title Company |
|---|---|---|---|
| Tayal Mukesh | $83,071 | None Available | |
| Roberts Thersa | -- | None Available | |
| Roberts Billy | $99,500 | None Available | |
| Roberts Billy L | $100,000 | None Available | |
| Huot Karon Celayne | $58,000 | -- |
Source: Public Records
Mortgage History
| Date | Status | Borrower | Loan Amount |
|---|---|---|---|
| Open | Tayal Mukesh | $150,000 | |
| Previous Owner | Roberts Billy | $29,683 | |
| Previous Owner | Roberts Billy | $105,560 | |
| Closed | Roberts Billy L | $0 |
Source: Public Records
Tax History Compared to Growth
Tax History
| Year | Tax Paid | Tax Assessment Tax Assessment Total Assessment is a certain percentage of the fair market value that is determined by local assessors to be the total taxable value of land and additions on the property. | Land | Improvement |
|---|---|---|---|---|
| 2024 | $3,430 | $174,400 | $32,000 | $142,400 |
| 2023 | $3,254 | $174,400 | $32,000 | $142,400 |
| 2022 | $3,230 | $138,100 | $26,300 | $111,800 |
| 2021 | $3,086 | $138,100 | $26,300 | $111,800 |
| 2020 | $3,116 | $123,700 | $23,400 | $100,300 |
| 2019 | $2,864 | $123,700 | $23,400 | $100,300 |
| 2018 | $2,830 | $115,100 | $20,400 | $94,700 |
| 2017 | $2,620 | $115,100 | $20,400 | $94,700 |
| 2016 | $2,548 | $105,400 | $18,400 | $87,000 |
| 2015 | $2,548 | $105,400 | $18,400 | $87,000 |
| 2014 | $2,518 | $103,500 | $17,900 | $85,600 |
Source: Public Records
Map
Nearby Homes
- 214 Bell Ave
- 216 Virginia Ave
- 326 Virginia Ave
- 403 Kirkwood Ave
- 701 Bell Ave
- 501 Kirkwood Ave
- 704 Creston Ave
- 211 Park Ave
- 310 E Broad St
- 2323 SW 9th St
- 505 Gray St
- 807 Virginia Ave
- 114 Fulton Dr
- 210 Fulton Dr
- 420 E Creston Ave
- 3306 S Union St
- 819 Olinda Ave
- 924 Creston Ave
- 124 E Olinda Ave
- 427 E Bell Ave
- 110 Loomis Ave
- 116 Loomis Ave
- 106 Loomis Ave
- 200 Loomis Ave
- 2700 South Union St
- 2724 South Union St
- 206 Loomis Ave
- 109 Loomis Ave
- 105 Loomis Ave
- 111 Loomis Ave
- 201 Loomis Ave
- 101 Loomis Ave
- 2802 South Union St
- 210 Loomis Ave
- 2802 S Union St
- 205 Loomis Ave
- 2715 South Union St
- 5 E Creston Ave
- 2711 South Union St
- 2717 South Union St