
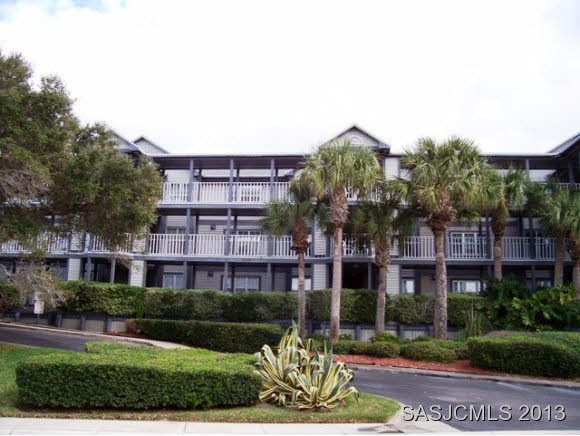
Beach Homes at Villages of Vilano 110 Ocean Hollow Ln Saint Augustine, FL 32084
Vilano Beach Neighborhood
2
Beds
2
Baths
973
Sq Ft
$588/mo
HOA Fee
Highlights
- Marina
- Beach Access
- Clubhouse
- Ketterlinus Elementary School Rated A
- Gated Community
- 4-minute walk to North Beach Park
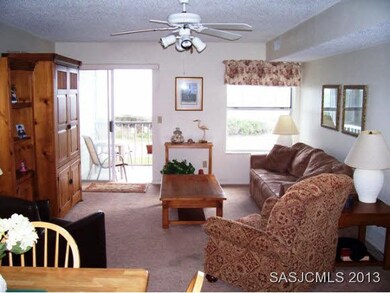
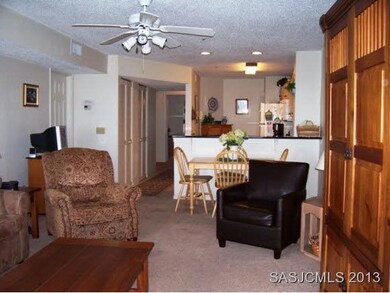
About This Home
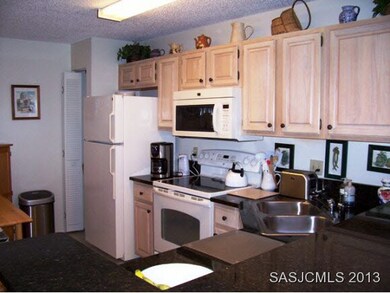
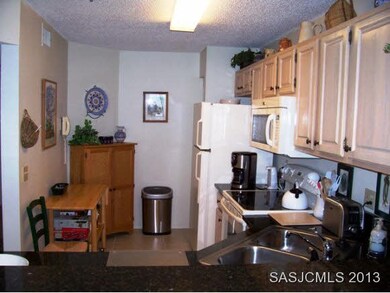
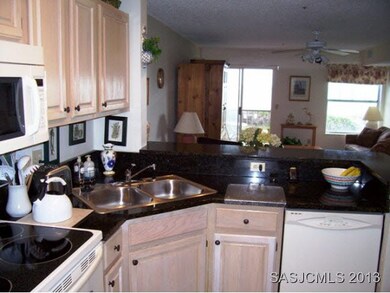
As of February 2022Enjoy the sights, sound and smell of the Atlantic Ocean from this well maintained 3rd flr. condo unit. This beauty feat. granite tops in kit., raised panel oak cabs, tile in kit. and baths, and newer appl. (range, microwave, dishwasher, washer, & dryer). Underground parking and storage unit incl. Assoc. amenities incl. tennis, indoor heated pool, sauna, jacuzzi, outside pool, walkway to beach and gazebo on beach, fitness center, boat/RV storage, and marina with launch area.
Last Agent to Sell the Property
TERRY SADOWSKI
RE/MAX Specialists (JAX) Listed on: 01/18/2013
Property Details
Home Type
- Condominium
Est. Annual Taxes
- $1,275
Year Built
- Built in 1989
HOA Fees
- $588 Monthly HOA Fees
Parking
- Parking Garage Space
Home Design
- Slab Foundation
- Frame Construction
- Shingle Roof
- Vinyl Siding
Interior Spaces
- 973 Sq Ft Home
- 3-Story Property
- Window Treatments
- Dining Room
- Screened Porch
- Security Gate
Kitchen
- Range
- Microwave
- Dishwasher
- Disposal
Flooring
- Carpet
- Tile
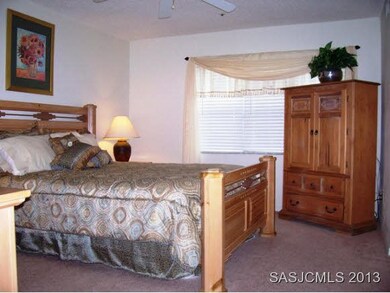
Bedrooms and Bathrooms
- 2 Bedrooms
- 2 Full Bathrooms
- Primary Bathroom includes a Walk-In Shower
Laundry
- Dryer
- Washer
Schools
- Ketterlinus Elementary School
- Sebastian Middle School
- St. Augustine High School
Additional Features
- Beach Access
- Central Heating and Cooling System
Listing and Financial Details
- Homestead Exemption
- Assessor Parcel Number 142385 0306
Community Details
Overview
- Association fees include boat/dock maintenance, community maintained, internal pest control, maintenance exterior, management, master policy, security, termite bond, trash collection
Amenities
- Clubhouse
- Elevator
Recreation
- Exercise Course
Security
- Gated Community
Similar Homes in the area
Create a Home Valuation Report for This Property
The Home Valuation Report is an in-depth analysis detailing your home's value as well as a comparison with similar homes in the area
Home Values in the Area
Average Home Value in this Area
Property History
| Date | Event | Price | Change | Sq Ft Price |
|---|---|---|---|---|
| 05/02/2025 05/02/25 | For Sale | $355,000 | -7.8% | $365 / Sq Ft |
| 12/13/2024 12/13/24 | For Sale | $385,000 | +75.0% | $396 / Sq Ft |
| 12/17/2023 12/17/23 | Off Market | $220,000 | -- | -- |
| 02/02/2022 02/02/22 | Sold | $370,000 | +0.3% | $384 / Sq Ft |
| 01/16/2022 01/16/22 | Pending | -- | -- | -- |
| 01/14/2022 01/14/22 | For Sale | $369,000 | +67.7% | $383 / Sq Ft |
| 09/14/2016 09/14/16 | Sold | $220,000 | -7.9% | $228 / Sq Ft |
| 07/17/2016 07/17/16 | Pending | -- | -- | -- |
| 02/08/2016 02/08/16 | For Sale | $238,900 | +27.4% | $248 / Sq Ft |
| 07/01/2015 07/01/15 | Sold | $187,500 | +1.4% | $195 / Sq Ft |
| 06/02/2015 06/02/15 | Pending | -- | -- | -- |
| 04/06/2015 04/06/15 | Sold | $185,000 | -7.5% | $192 / Sq Ft |
| 03/27/2015 03/27/15 | Pending | -- | -- | -- |
| 10/03/2014 10/03/14 | For Sale | $199,900 | +67.3% | $207 / Sq Ft |
| 08/08/2014 08/08/14 | Sold | $119,500 | -43.1% | $123 / Sq Ft |
| 07/08/2014 07/08/14 | For Sale | $210,000 | +55.7% | $218 / Sq Ft |
| 07/03/2014 07/03/14 | Sold | $134,900 | -29.0% | $140 / Sq Ft |
| 06/18/2014 06/18/14 | Pending | -- | -- | -- |
| 05/09/2014 05/09/14 | Pending | -- | -- | -- |
| 04/30/2014 04/30/14 | Sold | $190,000 | +46.2% | $197 / Sq Ft |
| 04/30/2014 04/30/14 | Pending | -- | -- | -- |
| 03/14/2014 03/14/14 | Sold | $130,000 | -6.5% | $134 / Sq Ft |
| 03/14/2014 03/14/14 | Pending | -- | -- | -- |
| 03/12/2014 03/12/14 | For Sale | $139,000 | +3.0% | $144 / Sq Ft |
| 02/10/2014 02/10/14 | For Sale | $135,000 | -40.5% | $139 / Sq Ft |
| 01/30/2014 01/30/14 | Sold | $227,000 | +92.4% | $173 / Sq Ft |
| 01/30/2014 01/30/14 | Pending | -- | -- | -- |
| 01/28/2014 01/28/14 | Sold | $118,000 | -38.7% | $121 / Sq Ft |
| 12/29/2013 12/29/13 | Pending | -- | -- | -- |
| 12/03/2013 12/03/13 | For Sale | $192,500 | -19.8% | $200 / Sq Ft |
| 11/15/2013 11/15/13 | For Sale | $239,900 | +73.8% | $183 / Sq Ft |
| 06/25/2013 06/25/13 | For Sale | $138,000 | +2.2% | $142 / Sq Ft |
| 06/21/2013 06/21/13 | Sold | $135,000 | -22.9% | $139 / Sq Ft |
| 06/21/2013 06/21/13 | Pending | -- | -- | -- |
| 05/15/2013 05/15/13 | Sold | $175,000 | +40.1% | $180 / Sq Ft |
| 05/02/2013 05/02/13 | For Sale | $124,900 | +66.5% | $128 / Sq Ft |
| 04/27/2013 04/27/13 | Pending | -- | -- | -- |
| 04/19/2013 04/19/13 | Sold | $75,000 | -62.5% | $82 / Sq Ft |
| 04/08/2013 04/08/13 | Pending | -- | -- | -- |
| 03/23/2013 03/23/13 | Sold | $200,000 | +141.0% | $152 / Sq Ft |
| 03/02/2013 03/02/13 | For Sale | $83,000 | -21.0% | $91 / Sq Ft |
| 02/21/2013 02/21/13 | Sold | $105,000 | -27.6% | $109 / Sq Ft |
| 02/11/2013 02/11/13 | Pending | -- | -- | -- |
| 02/11/2013 02/11/13 | For Sale | $145,000 | -27.5% | $149 / Sq Ft |
| 02/04/2013 02/04/13 | Pending | -- | -- | -- |
| 01/18/2013 01/18/13 | For Sale | $199,900 | +38.8% | $205 / Sq Ft |
| 11/12/2012 11/12/12 | For Sale | $144,000 | -34.2% | $149 / Sq Ft |
| 10/18/2012 10/18/12 | For Sale | $219,000 | +32.7% | $167 / Sq Ft |
| 04/27/2012 04/27/12 | Sold | $165,000 | +43.5% | $171 / Sq Ft |
| 04/12/2012 04/12/12 | Sold | $115,000 | -8.7% | $119 / Sq Ft |
| 04/12/2012 04/12/12 | Pending | -- | -- | -- |
| 02/07/2012 02/07/12 | Sold | $125,900 | -16.0% | $129 / Sq Ft |
| 02/04/2012 02/04/12 | Pending | -- | -- | -- |
| 01/12/2012 01/12/12 | Pending | -- | -- | -- |
| 11/18/2011 11/18/11 | For Sale | $149,900 | -16.2% | $154 / Sq Ft |
| 10/21/2011 10/21/11 | For Sale | $178,900 | -5.3% | $186 / Sq Ft |
| 05/09/2011 05/09/11 | For Sale | $189,000 | -- | $196 / Sq Ft |
Source: St. Augustine and St. Johns County Board of REALTORS®
Tax History Compared to Growth
Tax History
| Year | Tax Paid | Tax Assessment Tax Assessment Total Assessment is a certain percentage of the fair market value that is determined by local assessors to be the total taxable value of land and additions on the property. | Land | Improvement |
|---|---|---|---|---|
| 2025 | -- | -- | -- | -- |
| 2024 | -- | -- | -- | -- |
| 2023 | -- | -- | -- | -- |
| 2022 | -- | -- | -- | -- |
| 2021 | $0 | $0 | $0 | $0 |
| 2020 | $0 | $0 | $0 | $0 |
| 2019 | $0 | $0 | $0 | $0 |
| 2018 | $0 | $0 | $0 | $0 |
| 2016 | -- | $0 | $0 | $0 |
| 2015 | -- | $0 | $0 | $0 |
Source: Public Records
Agents Affiliated with this Home
-
Deborah Krantz
Seller's Agent in 2025
Deborah Krantz
Berkshire Hathaway HomeServices Florida Network Realty
(904) 484-4485
28 in this area
73 Total Sales
-
Mary Kelley Kryzwick
Seller's Agent in 2024
Mary Kelley Kryzwick
Berkshire Hathaway HomeServices Florida Network Realty
(904) 347-4024
1 in this area
63 Total Sales
-
C
Seller's Agent in 2022
COMP AGENT
Comp Office-Sold
-
DJ DellaSala
Buyer's Agent in 2022
DJ DellaSala
DJ & Lindsey Real Estate
(904) 643-6397
39 in this area
8,809 Total Sales
-
Vicki Brown
Seller's Agent in 2016
Vicki Brown
CENTURY 21 ST AUGUSTINE PROPERTIES
(904) 813-8662
93 Total Sales
-
Dawn Gaffney
Seller's Agent in 2015
Dawn Gaffney
Watson Realty Corp (US1 South)
(904) 495-0148
219 Total Sales
About Beach Homes at Villages of Vilano
Map
Source: St. Augustine and St. Johns County Board of REALTORS®
MLS Number: 140760
APN: 142385-0000
Disclaimer: Certain information contained herein is derived from information provided by parties other than Homes.com. All information provided is deemed reliable, but is not guaranteed to be accurate and should be independently verified.
![]() IDX information is provided exclusively for personal, non-commercial use, and may not be used for any purpose other than to identify prospective properties consumers may be interested in purchasing.
IDX information is provided exclusively for personal, non-commercial use, and may not be used for any purpose other than to identify prospective properties consumers may be interested in purchasing.
Information is deemed reliable but not guaranteed.
© 2025 St Augustine &
St. Johns County Board of REALTORS®. All rights reserved.
Nearby Homes
- 110 Ocean Hollow Ln Unit 114
- 110 Ocean Hollow Ln Unit 303
- 110 Ocean Hollow Ln Unit 116
- 110 Ocean Hollow Ln Unit 101
- 3741 Coastal Hwy
- 107 Hammock Cir
- 101 Carcaba Rd
- 310 Twenty Third St
- 148 Ocean Hollow Ln
- 310 23rd St
- 302 Twenty Third St
- 400 Village Dr
- 0 Carcaba Rd Unit 253438
- 2977 Coastal Hwy
- 605 Twenty Third St
- 603 Twenty Second St
- 604 Twenty Second St
- 605 Twenty Second St
- 607 Twenty Second St
- 609 Twenty Second St