110 S High St Marshall, MN 56258
Estimated Value: $267,000 - $308,825
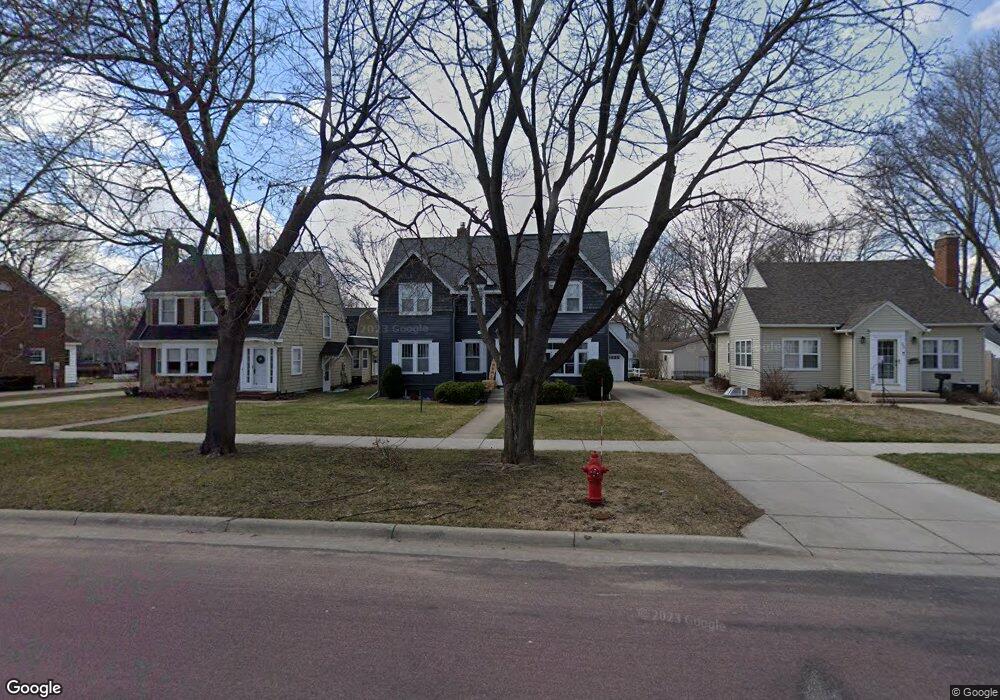
About This Home
This home is located at 110 S High St, Marshall, MN 56258 and is currently estimated at $286,206, approximately $150 per square foot. 110 S High St is a home located in Lyon County with nearby schools including Park Side Elementary School, West Side Elementary School, and Marshall Middle School.
Ownership History
We collect this data history from publicly available records. To have your information removed, we recommend requesting removal directly through your county’s website.
Purchase Details
Home Financials for this Owner
Home Financials are based on the most recent Mortgage that was taken out on this home.Purchase Details
Home Financials for this Owner
Home Financials are based on the most recent Mortgage that was taken out on this home.Purchase Details
Home Values in the Area
Average Home Value in this Area
Purchase History
We collect this data history from publicly available records. To have your information removed, we recommend requesting removal directly through your county’s website.
| Date | Buyer | Sale Price | Title Company |
|---|---|---|---|
| $270,000 | Lyon County Abstract & Title | ||
| $270,000 | Lyon County Abstract & Title | ||
| -- | None Available | ||
| $270,000 | -- |
Mortgage History
We collect this data history from publicly available records. To have your information removed, we recommend requesting removal directly through your county’s website.
| Date | Status | Borrower | Loan Amount |
|---|---|---|---|
| Open | $216,000 | ||
| Closed | $216,000 | ||
| Closed | $269,000 |
Tax History
We collect this data history from publicly available records. To have your information removed, we recommend requesting removal directly through your county’s website.
| Year | Tax Paid | Tax Assessment Tax Assessment Total Assessment is a certain percentage of the fair market value that is determined by local assessors to be the total taxable value of land and additions on the property. | Land | Improvement |
|---|---|---|---|---|
| 2025 | $2,288 | $235,700 | $23,700 | $212,000 |
| 2024 | $2,130 | $196,800 | $23,700 | $173,100 |
| 2023 | $2,220 | $184,100 | $23,700 | $160,400 |
| 2022 | $2,244 | $181,300 | $23,700 | $157,600 |
| 2021 | $2,074 | $146,000 | $23,700 | $122,300 |
| 2020 | $2,210 | $132,400 | $23,700 | $108,700 |
| 2019 | $2,028 | $141,600 | $23,700 | $117,900 |
| 2018 | $2,018 | $134,300 | $23,700 | $110,600 |
| 2017 | $2,018 | $134,300 | $23,700 | $110,600 |
| 2016 | $1,912 | $0 | $0 | $0 |
| 2015 | -- | $0 | $0 | $0 |
| 2014 | -- | $0 | $0 | $0 |
Map
- 206 S Whitney St
- 209 Walnut St
- 205 W Marshall St
- 906 Willow Ave
- 306 N Elm St
- 503 Washington Ave
- 103 Whitney Cir
- 413 Mason St
- 1203 Parkside Dr
- 605 Van Buren St
- 1208 E College Dr
- 905 Andrew St Unit 1
- 1011 Esther Cir
- 604 W Main St
- 606 W Main St
- 1216 Parkside Dr
- 116 S 5th St
- 606 E Main St
- 503 Darlene Dr
- 1104 Esther Cir
- 113 S High St
- 111 S High St
- 117 S High St
- 109 S High St
- 204 S Whitney St
- 202 S Whitney St
- 301 E Marshall St
- 208 S Whitney St
- 107 S High St
- 200 S Whitney St
- 116 S High St
- 114 S High St
- 112 S High St
- 210 S Whitney St
- 118 S High St
- 108 S Whitney St
- 120 S High St
- 105 S High St
- 306 E Marshall St
- 108 S High St
Ask me questions while you tour the home.