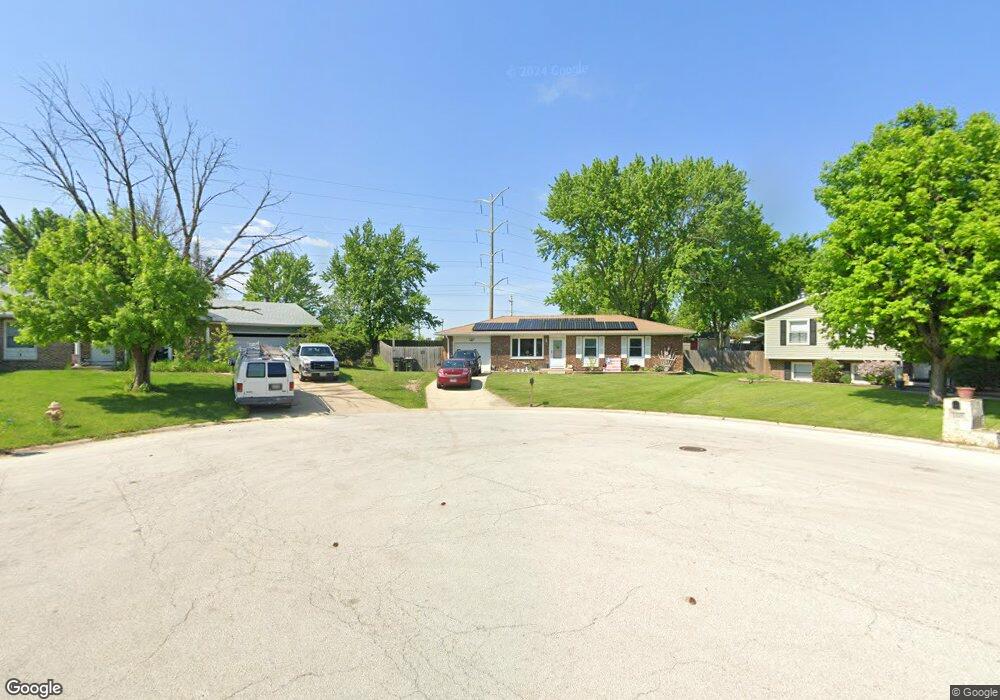
110 Saint George Ln Oswego, IL 60543
Northwest Oswego NeighborhoodEstimated Value: $273,462 - $307,000
--
Bed
--
Bath
1,008
Sq Ft
$294/Sq Ft
Est. Value
About This Home
This home is located at 110 Saint George Ln, Oswego, IL 60543 and is currently estimated at $296,366, approximately $294 per square foot. 110 Saint George Ln is a home located in Kendall County with nearby schools including Fox Chase Elementary School, Traughber Junior High School, and Oswego High School.
Ownership History
Date
Name
Owned For
Owner Type
Purchase Details
Closed on
Dec 26, 2013
Sold by
Schwartz Donald L and Pannell Tonilyn
Bought by
Pannell Tonilyn and Pannell Jerry
Current Estimated Value
Home Financials for this Owner
Home Financials are based on the most recent Mortgage that was taken out on this home.
Original Mortgage
$164,400
Outstanding Balance
$124,256
Interest Rate
4.42%
Mortgage Type
New Conventional
Estimated Equity
$172,110
Purchase Details
Closed on
May 11, 2001
Sold by
Morse Lisa L
Bought by
Schwartz Donald L and Schwartz Tonilyn
Home Financials for this Owner
Home Financials are based on the most recent Mortgage that was taken out on this home.
Original Mortgage
$125,100
Interest Rate
7.02%
Purchase Details
Closed on
Jul 22, 1999
Sold by
Smith Larry M and Smith Pamela L
Bought by
Morse Lisa L
Home Financials for this Owner
Home Financials are based on the most recent Mortgage that was taken out on this home.
Original Mortgage
$110,200
Interest Rate
7.54%
Create a Home Valuation Report for This Property
The Home Valuation Report is an in-depth analysis detailing your home's value as well as a comparison with similar homes in the area
Home Values in the Area
Average Home Value in this Area
Purchase History
| Date | Buyer | Sale Price | Title Company |
|---|---|---|---|
| Pannell Tonilyn | -- | None Available | |
| Schwartz Donald L | $139,000 | First American Title Ins Co | |
| Morse Lisa L | $116,000 | -- |
Source: Public Records
Mortgage History
| Date | Status | Borrower | Loan Amount |
|---|---|---|---|
| Open | Pannell Tonilyn | $164,400 | |
| Closed | Schwartz Donald L | $125,100 | |
| Previous Owner | Morse Lisa L | $110,200 |
Source: Public Records
Tax History Compared to Growth
Tax History
| Year | Tax Paid | Tax Assessment Tax Assessment Total Assessment is a certain percentage of the fair market value that is determined by local assessors to be the total taxable value of land and additions on the property. | Land | Improvement |
|---|---|---|---|---|
| 2024 | $5,616 | $76,951 | $18,767 | $58,184 |
| 2023 | $5,222 | $69,325 | $16,907 | $52,418 |
| 2022 | $5,222 | $64,790 | $15,801 | $48,989 |
| 2021 | $4,971 | $59,991 | $14,631 | $45,360 |
| 2020 | $4,858 | $58,244 | $14,205 | $44,039 |
| 2019 | $4,854 | $57,381 | $14,205 | $43,176 |
| 2018 | $4,066 | $48,830 | $12,088 | $36,742 |
| 2017 | $3,918 | $44,798 | $11,090 | $33,708 |
| 2016 | $3,842 | $43,493 | $10,767 | $32,726 |
| 2015 | $3,530 | $38,833 | $9,613 | $29,220 |
| 2014 | -- | $37,702 | $9,333 | $28,369 |
| 2013 | -- | $40,539 | $10,035 | $30,504 |
Source: Public Records
Map
Nearby Homes
- 102 Mary St
- 173 Dolores St
- 409 Fawn Dr
- 2100 Light Rd Unit 109
- 805 Cougar Ln
- 435 Fawn Dr
- 2300 Light Rd Unit 209
- 11-13 W Anchor Rd
- 7.43 Acres Vacant La State Route 31
- 1415 State Route 31
- 5.43 B-3 Commercial State Route 31
- 1721 State Route 31
- 602 Clearwater Ct Unit 2
- 608 Clearwater Ct
- 338 Millstream Ln Unit 1
- 238 Willowwood Dr
- 411 Bayberry Dr
- Parcel 004 & 003 Illinois 25
- 133 River Mist Dr Unit 3
- 403 Lake Ct
- 108 Saint George Ln
- 112 Saint George Ln
- 129 Kristine St
- 127 Kristine St
- 106 Saint George Ln
- 111 Saint George Ln
- 125 Kristine St
- 109 Saint George Ln
- 126 Kristine St
- 107 Saint George Ln Unit 2
- 104 Saint George Ln
- 123 Kristine St
- 184 Charles Ct
- 105 Saint George Ln
- 102 Saint George Ln
- 186 Charles Ct Unit 2
- 124 Kristine St
- 183 Charles Ct
- 121 Kristine St
- 122 Kristine St