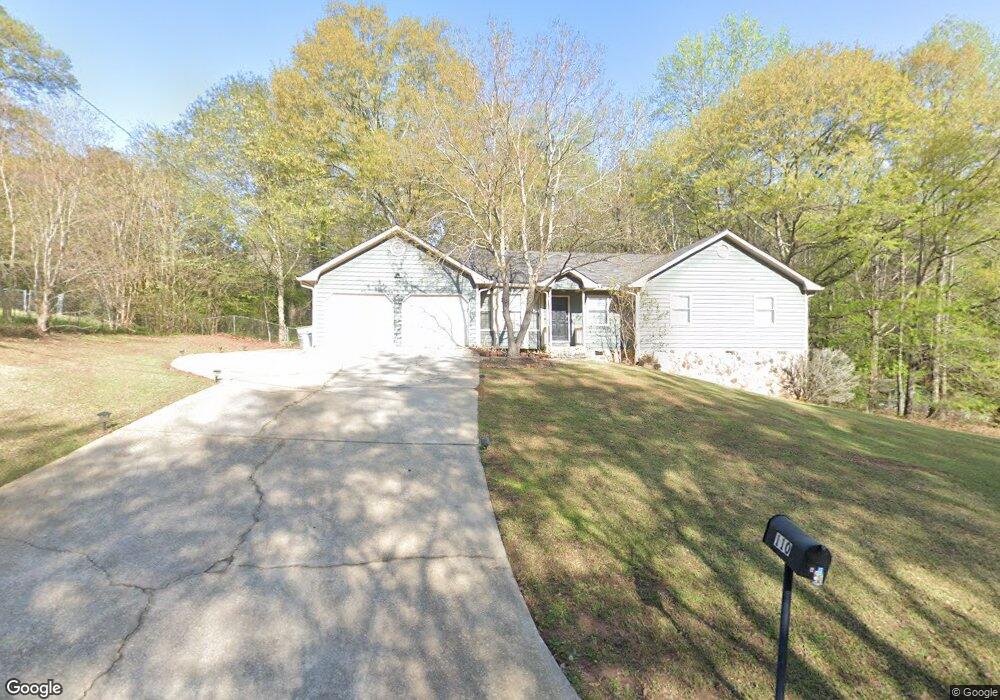
110 Springvalley Way Unit 2 Stockbridge, GA 30281
Estimated Value: $239,000 - $251,108
3
Beds
2
Baths
1,304
Sq Ft
$188/Sq Ft
Est. Value
About This Home
This home is located at 110 Springvalley Way Unit 2, Stockbridge, GA 30281 and is currently estimated at $245,027, approximately $187 per square foot. 110 Springvalley Way Unit 2 is a home located in Henry County with nearby schools including Cotton Indian Elementary School, Stockbridge Middle School, and Stockbridge High School.
Ownership History
Date
Name
Owned For
Owner Type
Purchase Details
Closed on
Oct 25, 2016
Sold by
Castle Atlanta Holding Lp
Bought by
Tah 2016 1 Borrower Llc
Current Estimated Value
Purchase Details
Closed on
May 6, 2014
Sold by
Ward Robert E
Bought by
Castle Atlanta Holdings Lp
Purchase Details
Closed on
Jun 15, 2007
Sold by
Ward Marie T
Bought by
Ward Robert E
Home Financials for this Owner
Home Financials are based on the most recent Mortgage that was taken out on this home.
Original Mortgage
$60,000
Interest Rate
6.16%
Mortgage Type
New Conventional
Purchase Details
Closed on
Sep 20, 2004
Sold by
Robertson Construction Co
Bought by
Jones Owen
Home Financials for this Owner
Home Financials are based on the most recent Mortgage that was taken out on this home.
Original Mortgage
$98,400
Interest Rate
6%
Mortgage Type
New Conventional
Purchase Details
Closed on
Oct 12, 1999
Sold by
Ward Robert E
Bought by
Ward Marie T
Create a Home Valuation Report for This Property
The Home Valuation Report is an in-depth analysis detailing your home's value as well as a comparison with similar homes in the area
Home Values in the Area
Average Home Value in this Area
Purchase History
| Date | Buyer | Sale Price | Title Company |
|---|---|---|---|
| Tah 2016 1 Borrower Llc | -- | -- | |
| Castle Atlanta Holdings Lp | $45,001 | -- | |
| Ward Robert E | -- | -- | |
| Jones Owen | $123,000 | -- | |
| Ward Marie T | -- | -- |
Source: Public Records
Mortgage History
| Date | Status | Borrower | Loan Amount |
|---|---|---|---|
| Previous Owner | Ward Robert E | $60,000 | |
| Previous Owner | Jones Owen | $98,400 |
Source: Public Records
Tax History Compared to Growth
Tax History
| Year | Tax Paid | Tax Assessment Tax Assessment Total Assessment is a certain percentage of the fair market value that is determined by local assessors to be the total taxable value of land and additions on the property. | Land | Improvement |
|---|---|---|---|---|
| 2024 | $3,830 | $95,400 | $14,000 | $81,400 |
| 2023 | $3,271 | $84,240 | $10,000 | $74,240 |
| 2022 | $2,318 | $59,400 | $10,000 | $49,400 |
| 2021 | $1,909 | $48,720 | $10,000 | $38,720 |
| 2020 | $1,705 | $43,400 | $8,000 | $35,400 |
| 2019 | $1,625 | $41,320 | $8,000 | $33,320 |
| 2018 | $1,363 | $34,480 | $6,000 | $28,480 |
| 2016 | $1,164 | $34,480 | $6,000 | $28,480 |
| 2015 | $752 | $18,000 | $3,024 | $14,976 |
| 2014 | $1,024 | $24,600 | $4,800 | $19,800 |
Source: Public Records
Map
Nearby Homes
- 135 Springvalley Way
- 270 Mays Rd
- 160 Springvalley Cir
- 20 King Place
- 146 Springvalley Cir
- 110 Wildwood Rd Unit 2
- 128 Belair Ln Unit 1
- 277 Edison Dr
- 245 Amanda Ct
- 0 Chimney Smoke Dr Unit 10412469
- 297 Edison Dr
- 393 & 381 Old Conyers Rd
- 69 Belair Dr
- 135 Chimney Ridge Trail
- 0 E Atlanta Rd Unit @KINSEY DR 10464743
- 0 E Atlanta Rd Unit @VALERIE CT 10464740
- 117 Valerie Ct
- 90 Chimney Rise Ct
- 905 E Atlanta Rd
- 169 Zircon Ln
- 100 Springvalley Way
- 120 Springvalley Way
- 14 Lee Rd
- 105 Springvalley Way
- 120 Springvalley Cir
- 125 Springvalley Way
- 130 Springvalley Way
- 122 Springvalley Cir
- 10 Lee Rd
- 116 Springvalley Cir
- 0 Springvalley Way
- 20 Lee Rd
- 124 Springvalley Cir
- 140 Springvalley Way
- 115 Springvalley Cir
- 168 Springvalley Cir
- 126 Springvalley Cir
- 25 Lee Rd
- 121 Springvalley Cir
- 15 Lee Rd