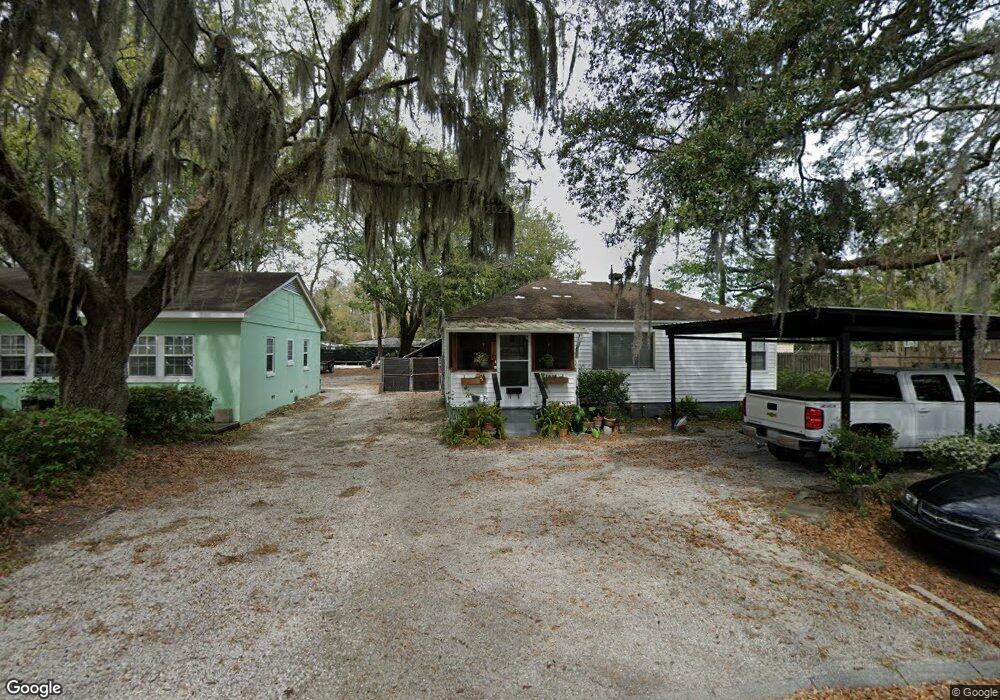
110 W 56th St Savannah, GA 31405
Bingville NeighborhoodEstimated Value: $114,000 - $622,000
3
Beds
1
Bath
1,147
Sq Ft
$235/Sq Ft
Est. Value
About This Home
This home is located at 110 W 56th St, Savannah, GA 31405 and is currently estimated at $269,316, approximately $234 per square foot. 110 W 56th St is a home located in Chatham County with nearby schools including Haven Elementary School, Myers Middle School, and Beach High School.
Ownership History
Date
Name
Owned For
Owner Type
Purchase Details
Closed on
Oct 6, 2022
Sold by
Czoa Llc
Bought by
Vargas Ma Leonor and Hernandez Sergio
Current Estimated Value
Home Financials for this Owner
Home Financials are based on the most recent Mortgage that was taken out on this home.
Original Mortgage
$43,000
Outstanding Balance
$1,300
Interest Rate
5.89%
Mortgage Type
New Conventional
Estimated Equity
$268,016
Purchase Details
Closed on
Jan 2, 2014
Sold by
Dubberly Zelda R
Bought by
Czoa Llc
Create a Home Valuation Report for This Property
The Home Valuation Report is an in-depth analysis detailing your home's value as well as a comparison with similar homes in the area
Home Values in the Area
Average Home Value in this Area
Purchase History
| Date | Buyer | Sale Price | Title Company |
|---|---|---|---|
| Vargas Ma Leonor | $85,000 | -- | |
| Czoa Llc | -- | -- |
Source: Public Records
Mortgage History
| Date | Status | Borrower | Loan Amount |
|---|---|---|---|
| Open | Vargas Ma Leonor | $43,000 |
Source: Public Records
Tax History Compared to Growth
Tax History
| Year | Tax Paid | Tax Assessment Tax Assessment Total Assessment is a certain percentage of the fair market value that is determined by local assessors to be the total taxable value of land and additions on the property. | Land | Improvement |
|---|---|---|---|---|
| 2025 | $3,424 | $56,280 | $11,080 | $45,200 |
| 2024 | $3,424 | $58,920 | $11,080 | $47,840 |
| 2023 | $601 | $34,000 | $7,280 | $26,720 |
| 2022 | $502 | $41,160 | $6,720 | $34,440 |
| 2021 | $1,651 | $35,320 | $5,360 | $29,960 |
| 2020 | $864 | $27,360 | $2,840 | $24,520 |
| 2019 | $1,031 | $27,360 | $2,840 | $24,520 |
| 2018 | $1,043 | $23,200 | $2,840 | $20,360 |
| 2017 | $1,025 | $24,560 | $3,640 | $20,920 |
| 2016 | $719 | $24,640 | $3,640 | $21,000 |
| 2015 | $1,043 | $25,000 | $3,640 | $21,360 |
| 2014 | $1,407 | $25,360 | $0 | $0 |
Source: Public Records
Map
Nearby Homes