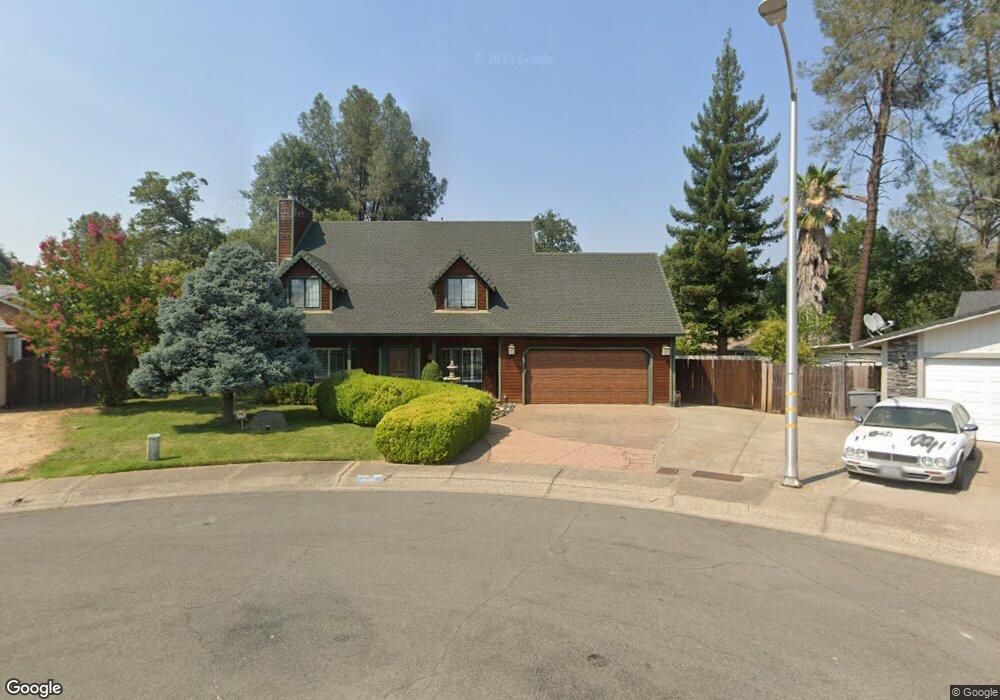
1100 Hanover Ct Redding, CA 96003
Lema Ranch NeighborhoodEstimated Value: $487,493 - $515,000
4
Beds
3
Baths
2,262
Sq Ft
$219/Sq Ft
Est. Value
About This Home
This home is located at 1100 Hanover Ct, Redding, CA 96003 and is currently estimated at $496,123, approximately $219 per square foot. 1100 Hanover Ct is a home located in Shasta County with nearby schools including Mistletoe Elementary School, Foothill High School, and Redding School Of The Arts.
Ownership History
Date
Name
Owned For
Owner Type
Purchase Details
Closed on
Jul 30, 2001
Sold by
Jewell Gary D and Jewell Deborah J
Bought by
Jewell Gary Dean
Current Estimated Value
Home Financials for this Owner
Home Financials are based on the most recent Mortgage that was taken out on this home.
Original Mortgage
$174,400
Interest Rate
7.09%
Purchase Details
Closed on
Apr 15, 2001
Sold by
Dean Jewell Gary
Bought by
Jewell Gary D and Jewell Deborah J
Purchase Details
Closed on
Jan 25, 2001
Sold by
Hilty Deborah J and Hilty Gary D
Bought by
Bordeaux Michael J and Bordeaux Diana L
Home Financials for this Owner
Home Financials are based on the most recent Mortgage that was taken out on this home.
Original Mortgage
$108,000
Interest Rate
7.41%
Mortgage Type
VA
Create a Home Valuation Report for This Property
The Home Valuation Report is an in-depth analysis detailing your home's value as well as a comparison with similar homes in the area
Home Values in the Area
Average Home Value in this Area
Purchase History
| Date | Buyer | Sale Price | Title Company |
|---|---|---|---|
| Jewell Gary Dean | -- | Alliance Title Company | |
| Jewell Gary D | -- | -- | |
| Bordeaux Michael J | $108,000 | Chicago Title Co |
Source: Public Records
Mortgage History
| Date | Status | Borrower | Loan Amount |
|---|---|---|---|
| Closed | Jewell Gary Dean | $174,400 | |
| Closed | Bordeaux Michael J | $108,000 |
Source: Public Records
Tax History
| Year | Tax Paid | Tax Assessment Tax Assessment Total Assessment is a certain percentage of the fair market value that is determined by local assessors to be the total taxable value of land and additions on the property. | Land | Improvement |
|---|---|---|---|---|
| 2025 | $2,845 | $268,519 | $47,833 | $220,686 |
| 2024 | $2,804 | $263,255 | $46,896 | $216,359 |
| 2023 | $2,804 | $258,094 | $45,977 | $212,117 |
| 2022 | $2,723 | $253,034 | $45,076 | $207,958 |
| 2021 | $2,629 | $248,074 | $44,193 | $203,881 |
| 2020 | $2,617 | $245,531 | $43,740 | $201,791 |
| 2019 | $2,594 | $240,718 | $42,883 | $197,835 |
| 2018 | $2,563 | $235,999 | $42,043 | $193,956 |
| 2017 | $2,607 | $231,372 | $41,219 | $190,153 |
| 2016 | $2,437 | $226,836 | $40,411 | $186,425 |
| 2015 | $2,416 | $223,429 | $39,804 | $183,625 |
| 2014 | $2,397 | $219,054 | $39,025 | $180,029 |
Source: Public Records
Map
Nearby Homes
- 2001 S Ridge Dr
- 953 Oakmont Dr
- 1991 Tiburon Dr
- 785 Mallard St
- 1479 Atajo Ct
- 1376 Fitz Place
- 1090 Gibralter Rd
- 1595 Sterling Dr
- 1285 Lancers Ln
- 2370 Candlewood Dr
- 1088 Burton Dr
- 2566 Dewberry Dr
- 1953 Cameo Ct
- 1865 Dellwood Dr
- 2093 Victor Ave
- 2178 Hemingway St
- 1750 Hawthorne Ct
- 2134 Cadjew St
- 2110 Cadjew St
- 2935 Snow Fire Ct
- 1134 Belcrest Dr
- 1155 Hanover Ct
- 1160 Hanover Ct
- 1146 Belcrest Dr
- 1128 Belcrest Dr
- 1190 Hanover Ct
- 1189 Hanover Ct
- 1162 Belcrest Dr
- 1122 Belcrest Dr
- 1178 Belcrest Dr
- 1820 Edgewood Dr
- 1163 Kirkwood Cir
- 1171 Kirkwood Cir
- 1188 Belcrest Dr
- 1133 Belcrest Dr
- 1141 Belcrest Dr
- 1855 Edgewood Dr
- 1843 Edgewood Dr
- 1125 Belcrest Dr
- 1110 Belcrest Dr
Your Personal Tour Guide
Ask me questions while you tour the home.