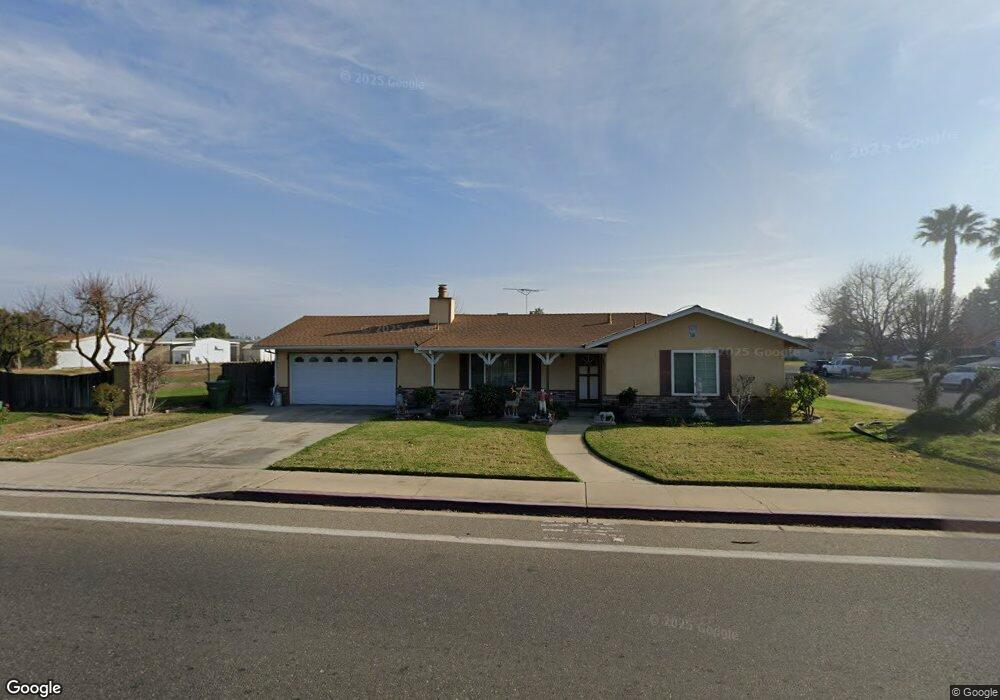
1100 N Tully Rd Turlock, CA 95380
Estimated Value: $314,000 - $417,000
3
Beds
2
Baths
1,044
Sq Ft
$359/Sq Ft
Est. Value
About This Home
This home is located at 1100 N Tully Rd, Turlock, CA 95380 and is currently estimated at $374,590, approximately $358 per square foot. 1100 N Tully Rd is a home located in Stanislaus County with nearby schools including Crowell Elementary School, Marvin A. Dutcher Middle School, and Turlock Junior High School.
Ownership History
Date
Name
Owned For
Owner Type
Purchase Details
Closed on
Sep 21, 2010
Sold by
Johnson Maria L
Bought by
Fernandes Jose J
Current Estimated Value
Purchase Details
Closed on
Feb 10, 2003
Sold by
Fernandes Cesar and Fernandes Maria
Bought by
Fernandes Jose J and Johnson Maria L
Purchase Details
Closed on
Feb 13, 1996
Sold by
Fernandes Jose Joaquin Quaresma and Silveira Maria Hortencia
Bought by
Fernandes Ceasar and Fernandes Maria
Create a Home Valuation Report for This Property
The Home Valuation Report is an in-depth analysis detailing your home's value as well as a comparison with similar homes in the area
Home Values in the Area
Average Home Value in this Area
Purchase History
| Date | Buyer | Sale Price | Title Company |
|---|---|---|---|
| Fernandes Jose J | -- | None Available | |
| Fernandes Jose J | -- | -- | |
| Fernandes Ceasar | -- | -- |
Source: Public Records
Tax History Compared to Growth
Tax History
| Year | Tax Paid | Tax Assessment Tax Assessment Total Assessment is a certain percentage of the fair market value that is determined by local assessors to be the total taxable value of land and additions on the property. | Land | Improvement |
|---|---|---|---|---|
| 2025 | $1,361 | $133,598 | $31,060 | $102,538 |
| 2024 | $1,335 | $130,979 | $30,451 | $100,528 |
| 2023 | $1,331 | $128,411 | $29,854 | $98,557 |
| 2022 | $1,313 | $125,894 | $29,269 | $96,625 |
| 2021 | $1,292 | $123,427 | $28,696 | $94,731 |
| 2020 | $1,282 | $122,162 | $28,402 | $93,760 |
| 2019 | $1,259 | $119,768 | $27,846 | $91,922 |
| 2018 | $1,257 | $117,420 | $27,300 | $90,120 |
| 2017 | $1,226 | $115,118 | $26,765 | $88,353 |
| 2016 | $1,144 | $112,862 | $26,241 | $86,621 |
| 2015 | $1,132 | $111,167 | $25,847 | $85,320 |
| 2014 | $1,120 | $108,990 | $25,341 | $83,649 |
Source: Public Records
Map
Nearby Homes
- 1357 Mark Ct
- 981 Countryside Dr
- 842 Lazarine Ct
- 1400 N Tully Rd Unit 173
- 1400 N Tully Rd Unit 187
- 2450 Fulkerth Rd
- 2400 Fulkerth Rd
- 500 N Tully Rd Unit 39
- 500 N Tully Rd Unit 110
- 2631 Polous Dr
- 1228 Magic Sands Way
- 2175 W Main St
- 1330 Dianne Dr
- 1043 Chestnut St
- 900 W Canal Dr Unit 100
- 2226 Typhoon Ct
- 984 Park St
- 2625 W Main St
- 2391 Typhoon Dr
- 2101 State St
- 2075 Joett Dr
- 2098 Joett Dr
- 2059 Joett Dr
- 1121 N Tully Rd
- 1141 N Tully Rd
- 1091 N Tully Rd
- 2074 Joett Dr
- 1151 N Tully Rd
- 2045 Joett Dr
- 1050 N Tully Rd
- 2101 Aspenwood Dr
- 1120 Chelsea Place
- 1130 Chelsea Place
- 1051 Credence Ct
- 1000 N Tully Rd
- 2029 Joett Dr
- 1140 Chelsea Place
- 2180 Chelsea Place
- 2151 Aspenwood Dr
- 2105 Mayfaire Dr