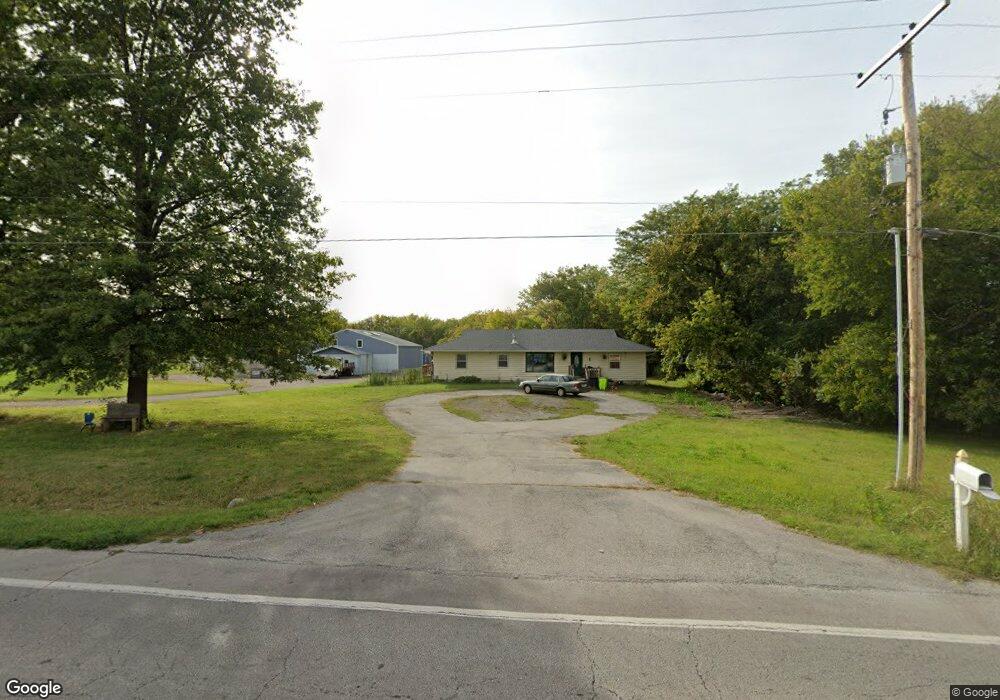
1100 S Cedar St Belton, MO 64012
Estimated Value: $271,000 - $390,000
4
Beds
2
Baths
1,392
Sq Ft
$224/Sq Ft
Est. Value
About This Home
This home is located at 1100 S Cedar St, Belton, MO 64012 and is currently estimated at $311,740, approximately $223 per square foot. 1100 S Cedar St is a home located in Cass County with nearby schools including Cambridge Elementary School, Belton Middle School, and Mill Creek Upper Elementary School.
Ownership History
Date
Name
Owned For
Owner Type
Purchase Details
Closed on
Oct 22, 2009
Sold by
Forbes Victoria J
Bought by
Rhodes Brett
Current Estimated Value
Purchase Details
Closed on
Aug 28, 2008
Sold by
Annuity Brokerage Co
Bought by
Forbes Victoria J
Home Financials for this Owner
Home Financials are based on the most recent Mortgage that was taken out on this home.
Original Mortgage
$84,000
Interest Rate
6.57%
Mortgage Type
New Conventional
Purchase Details
Closed on
Jan 1, 2007
Sold by
Morrison Dennis F
Bought by
Annuity Brokerage Co
Purchase Details
Closed on
Apr 13, 2006
Sold by
Hankins Gale C and Hankins Joyce S
Bought by
Morrison Dennis F
Home Financials for this Owner
Home Financials are based on the most recent Mortgage that was taken out on this home.
Original Mortgage
$98,000
Interest Rate
6.5%
Mortgage Type
Purchase Money Mortgage
Create a Home Valuation Report for This Property
The Home Valuation Report is an in-depth analysis detailing your home's value as well as a comparison with similar homes in the area
Home Values in the Area
Average Home Value in this Area
Purchase History
| Date | Buyer | Sale Price | Title Company |
|---|---|---|---|
| Rhodes Brett | -- | None Available | |
| Forbes Victoria J | -- | -- | |
| Annuity Brokerage Co | -- | -- | |
| Morrison Dennis F | -- | -- |
Source: Public Records
Mortgage History
| Date | Status | Borrower | Loan Amount |
|---|---|---|---|
| Previous Owner | Forbes Victoria J | $84,000 | |
| Previous Owner | Morrison Dennis F | $98,000 |
Source: Public Records
Tax History Compared to Growth
Tax History
| Year | Tax Paid | Tax Assessment Tax Assessment Total Assessment is a certain percentage of the fair market value that is determined by local assessors to be the total taxable value of land and additions on the property. | Land | Improvement |
|---|---|---|---|---|
| 2024 | $2,120 | $25,710 | $6,730 | $18,980 |
| 2023 | $2,114 | $25,710 | $6,730 | $18,980 |
| 2022 | $1,865 | $22,480 | $6,730 | $15,750 |
| 2021 | $1,865 | $22,480 | $6,730 | $15,750 |
| 2020 | $1,838 | $22,020 | $6,730 | $15,290 |
| 2019 | $1,800 | $22,020 | $6,730 | $15,290 |
| 2018 | $1,581 | $19,510 | $5,390 | $14,120 |
| 2017 | $1,535 | $19,510 | $5,390 | $14,120 |
| 2016 | $1,535 | $18,830 | $5,390 | $13,440 |
| 2015 | $1,535 | $18,830 | $5,390 | $13,440 |
| 2014 | $1,603 | $19,610 | $4,580 | $15,030 |
| 2013 | -- | $19,610 | $4,580 | $15,030 |
Source: Public Records
Map
Nearby Homes
- 1113 Kent Dr
- 914 Ridge Dr
- 510 Logan Ave
- 117 Melody Ln
- 215 Park Ave
- 700 Emerson Dr
- 406 Catron Ave
- 702 Park Cir
- 104 E Sunrise Dr
- 604 Pawnee Ln
- 1004 Main St
- 1201 Mesa Dr
- 621 Fall Meadow Ln
- 303 W Sunrise Dr
- 508 3rd St
- 605 Poplar Ct
- 705 Poplar Cir
- Aldridge Plan at Autumn Ridge
- Newcastle Plan at Autumn Ridge
- Bellamy Plan at Autumn Ridge
- 1100 S Cedar St
- 1106 S Cedar St
- 912 S Cedar St
- 1116 S Cedar St
- 18017 S State Route Y
- 137 Brentwood 139 141 143 Dr
- 943 Mulberry St
- 941 Mulberry St
- 939 Mulberry St
- 902 S Cedar St
- 937 Mulberry St
- 935 Mulberry St
- 923 Mulberry St
- 944 Mulberry St
- 933 Mulberry St
- 142 Brentwood Dr
- 950 Mulberry St
- 931 Mulberry St
- 946 Mulberry St Unit 950
- 911 S Cedar St