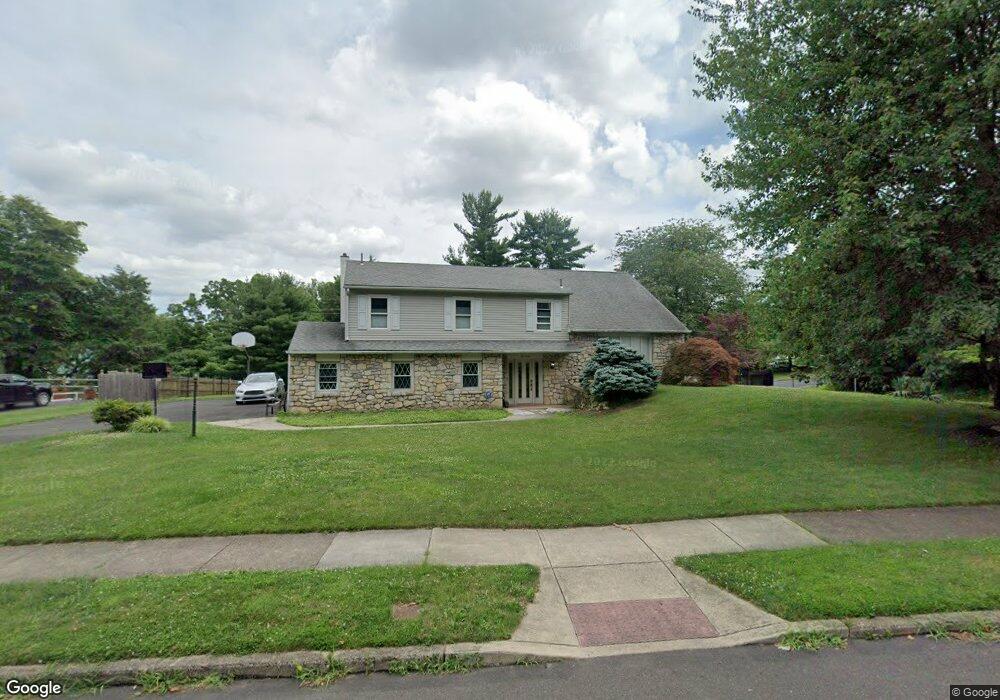
1100 University Dr Yardley, PA 19067
Estimated Value: $731,000 - $856,000
4
Beds
3
Baths
3,174
Sq Ft
$254/Sq Ft
Est. Value
About This Home
This home is located at 1100 University Dr, Yardley, PA 19067 and is currently estimated at $804,699, approximately $253 per square foot. 1100 University Dr is a home located in Bucks County with nearby schools including Quarry Hill El School, Pennwood Middle School, and Pennsbury High School.
Ownership History
Date
Name
Owned For
Owner Type
Purchase Details
Closed on
Jan 19, 2011
Sold by
U S Bank National Association
Bought by
Horst Michael and Auker Meridith
Current Estimated Value
Home Financials for this Owner
Home Financials are based on the most recent Mortgage that was taken out on this home.
Original Mortgage
$401,465
Interest Rate
4.5%
Mortgage Type
FHA
Purchase Details
Closed on
Jun 4, 2010
Sold by
Shim Jae Soo and Shim Jeong H
Bought by
Us Bank National Association
Purchase Details
Closed on
Aug 10, 2005
Sold by
Atallah Jennifer G and Atallah Wasef S
Bought by
Shim Jae Soo and Shim Jeong H
Home Financials for this Owner
Home Financials are based on the most recent Mortgage that was taken out on this home.
Original Mortgage
$53,450
Interest Rate
5.92%
Mortgage Type
Credit Line Revolving
Create a Home Valuation Report for This Property
The Home Valuation Report is an in-depth analysis detailing your home's value as well as a comparison with similar homes in the area
Home Values in the Area
Average Home Value in this Area
Purchase History
| Date | Buyer | Sale Price | Title Company |
|---|---|---|---|
| Horst Michael | $367,000 | None Available | |
| Us Bank National Association | $878 | None Available | |
| Shim Jae Soo | $534,500 | None Available |
Source: Public Records
Mortgage History
| Date | Status | Borrower | Loan Amount |
|---|---|---|---|
| Previous Owner | Horst Michael | $401,465 | |
| Previous Owner | Shim Jae Soo | $53,450 | |
| Previous Owner | Shim Jae Soo | $427,600 |
Source: Public Records
Tax History Compared to Growth
Tax History
| Year | Tax Paid | Tax Assessment Tax Assessment Total Assessment is a certain percentage of the fair market value that is determined by local assessors to be the total taxable value of land and additions on the property. | Land | Improvement |
|---|---|---|---|---|
| 2025 | $10,418 | $44,000 | $11,480 | $32,520 |
| 2024 | $10,418 | $44,000 | $11,480 | $32,520 |
| 2023 | $9,896 | $44,000 | $11,480 | $32,520 |
| 2022 | $9,681 | $44,000 | $11,480 | $32,520 |
| 2021 | $9,528 | $44,000 | $11,480 | $32,520 |
| 2020 | $9,528 | $44,000 | $11,480 | $32,520 |
| 2019 | $9,339 | $44,000 | $11,480 | $32,520 |
| 2018 | $9,175 | $44,000 | $11,480 | $32,520 |
| 2017 | $8,891 | $44,000 | $11,480 | $32,520 |
| 2016 | $8,788 | $44,000 | $11,480 | $32,520 |
| 2015 | -- | $44,000 | $11,480 | $32,520 |
| 2014 | -- | $44,000 | $11,480 | $32,520 |
Source: Public Records
Map
Nearby Homes
- 1190 University Dr
- 0 Sandy Run Rd Unit PABU2098286
- 0 Sandy Run Rd Unit PABU2099898
- 0 Sandy Run Rd Unit PABU2099912
- 25 Creekview Ln
- 1208 Dickinson Dr
- 42 W College Ave Unit 316
- 42 W College Ave Unit 324
- 42 W College Ave Unit 222
- 140 N Main St
- 55 Fairway Dr
- 0 Dolington Rd
- 833 Winthrop Dr
- 963 Hunt Dr
- 885 Henry Dr
- 151 Dolington Rd
- 1 Austin Rd
- 17 Highland Dr
- 226 Meadow Dr
- 109 Longshore Ave
- 1104 University Dr
- 1108 University Dr
- 1071 Princeton Rd
- 1024 Lehigh Dr
- 1070 Princeton Rd
- 1073 Princeton Rd
- 1 Sandy Run Rd
- 1023 Lehigh Dr
- 1032 University Dr
- 1112 University Dr
- 1018 Lehigh Dr
- 1072 Princeton Rd
- 1109 University Dr
- 213 W Afton Ave
- 1075 Princeton Rd
- 1111 University Dr
- 1116 University Dr
- 1012 Lehigh Dr
- 1028 University Dr
- 1029 University Dr