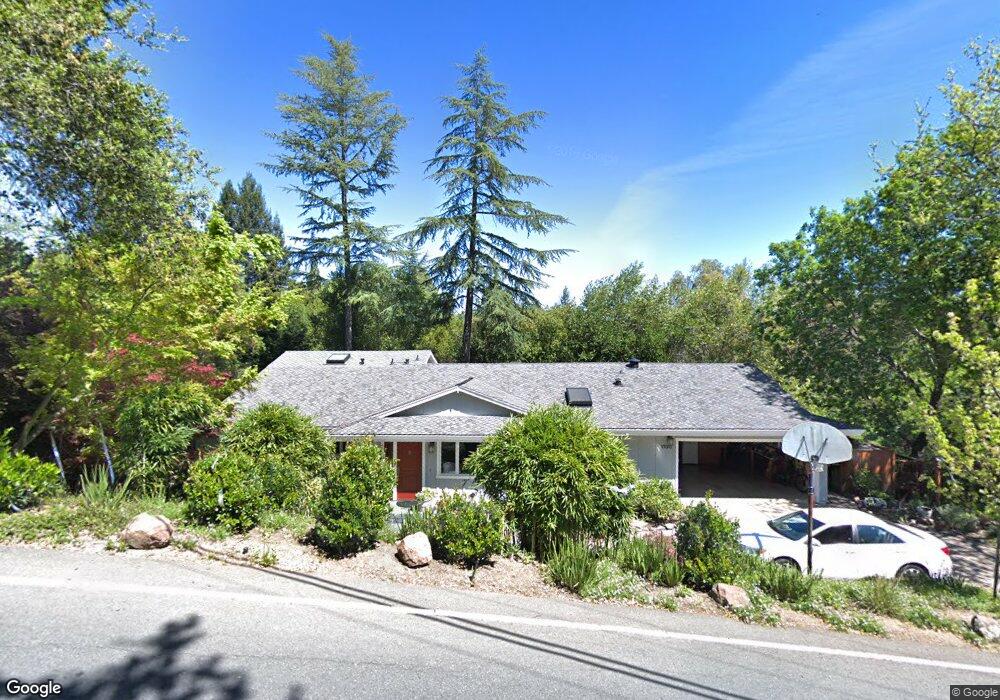
1100 Via Roble Lafayette, CA 94549
Happy Valley NeighborhoodEstimated Value: $1,960,944 - $2,187,000
3
Beds
2
Baths
2,584
Sq Ft
$813/Sq Ft
Est. Value
About This Home
This home is located at 1100 Via Roble, Lafayette, CA 94549 and is currently estimated at $2,100,486, approximately $812 per square foot. 1100 Via Roble is a home located in Contra Costa County with nearby schools including Happy Valley Elementary School, M.H. Stanley Middle School, and Acalanes High School.
Ownership History
Date
Name
Owned For
Owner Type
Purchase Details
Closed on
Oct 13, 2017
Sold by
Clarkson Patrick T and Clarkson Ann S
Bought by
Clarkson Patrick T and Clarkson Ann S
Current Estimated Value
Home Financials for this Owner
Home Financials are based on the most recent Mortgage that was taken out on this home.
Original Mortgage
$261,000
Interest Rate
3.78%
Mortgage Type
New Conventional
Purchase Details
Closed on
Apr 10, 2008
Sold by
Clarkson Patrick T and Clarkson Ann S
Bought by
Clarkson Patrick T and Clarkson Ann S
Home Financials for this Owner
Home Financials are based on the most recent Mortgage that was taken out on this home.
Original Mortgage
$330,000
Interest Rate
5.99%
Mortgage Type
Stand Alone Refi Refinance Of Original Loan
Purchase Details
Closed on
Mar 22, 1999
Sold by
Clarkson Patrick T and Clarkson Ann S
Bought by
Clarkson Patrick T and Clarkson Ann S
Create a Home Valuation Report for This Property
The Home Valuation Report is an in-depth analysis detailing your home's value as well as a comparison with similar homes in the area
Home Values in the Area
Average Home Value in this Area
Purchase History
| Date | Buyer | Sale Price | Title Company |
|---|---|---|---|
| Clarkson Patrick T | -- | Lawyers Title Company | |
| Clarkson Patrick T | -- | Lawyers Title Company | |
| Clarkson Patrick T | -- | Old Republic Title Company | |
| Clarkson Patrick T | -- | Old Republic Title Company | |
| Clarkson Patrick T | -- | -- |
Source: Public Records
Mortgage History
| Date | Status | Borrower | Loan Amount |
|---|---|---|---|
| Closed | Clarkson Patrick T | $261,000 | |
| Closed | Clarkson Patrick T | $330,000 |
Source: Public Records
Tax History Compared to Growth
Tax History
| Year | Tax Paid | Tax Assessment Tax Assessment Total Assessment is a certain percentage of the fair market value that is determined by local assessors to be the total taxable value of land and additions on the property. | Land | Improvement |
|---|---|---|---|---|
| 2025 | $10,909 | $858,140 | $478,329 | $379,811 |
| 2024 | $10,704 | $841,314 | $468,950 | $372,364 |
| 2023 | $10,704 | $824,818 | $459,755 | $365,063 |
| 2022 | $10,534 | $808,646 | $450,741 | $357,905 |
| 2021 | $10,221 | $792,791 | $441,903 | $350,888 |
| 2019 | $9,823 | $769,279 | $428,797 | $340,482 |
| 2018 | $9,469 | $754,196 | $420,390 | $333,806 |
| 2017 | $9,302 | $739,409 | $412,148 | $327,261 |
| 2016 | $8,531 | $724,912 | $404,067 | $320,845 |
| 2015 | $8,288 | $714,024 | $397,998 | $316,026 |
| 2014 | $8,207 | $700,038 | $390,202 | $309,836 |
Source: Public Records
Map
Nearby Homes
- 3938 Los Arabis Dr
- 80 Woodbury Highlands Place Unit 16
- 1149 Camino Vallecito
- 3958 Franke Ln
- Residence E111 Plan at The Brant
- Residence E315 Plan at The Brant
- Residence E308 Plan at The Brant
- Residence E211 Plan at The Brant
- Residence E302 Plan at The Brant
- Residence E312 Plan at The Brant
- Residence E210 Plan at The Brant
- Residence E313 Plan at The Brant
- Residence E215 Plan at The Brant
- Residence E109 Plan at The Brant
- Residence E110 Plan at The Brant
- Residence E212 Plan at The Brant
- 3664 Mt Diablo Blvd Unit E111
- 3664 Mt Diablo Blvd Unit E110
- 3664 Mt Diablo Blvd Unit E210
- 3664 Mt Diablo Blvd Unit E215
- 1102 Via Roble
- 3847 Quail Ridge Rd
- 3885 Quail Ridge Rd
- 1098 Via Roble
- 3839 Quail Ridge Rd
- 1095 Via Roble
- 3851 Quail Ridge Rd
- 1091 Via Roble
- 1099 Via Roble
- 1096 Via Roble
- 3875 Quail Ridge Rd
- 3867 Quail Ridge Rd
- 3840 Quail Ridge Rd
- 3833 Quail Ridge Rd
- 1089 Via Roble
- 3891 Quail Ridge Rd
- 1092 Via Roble
- 3848 Quail Ridge Rd
- 1101 Via Roble
- 3852 Quail Ridge Rd