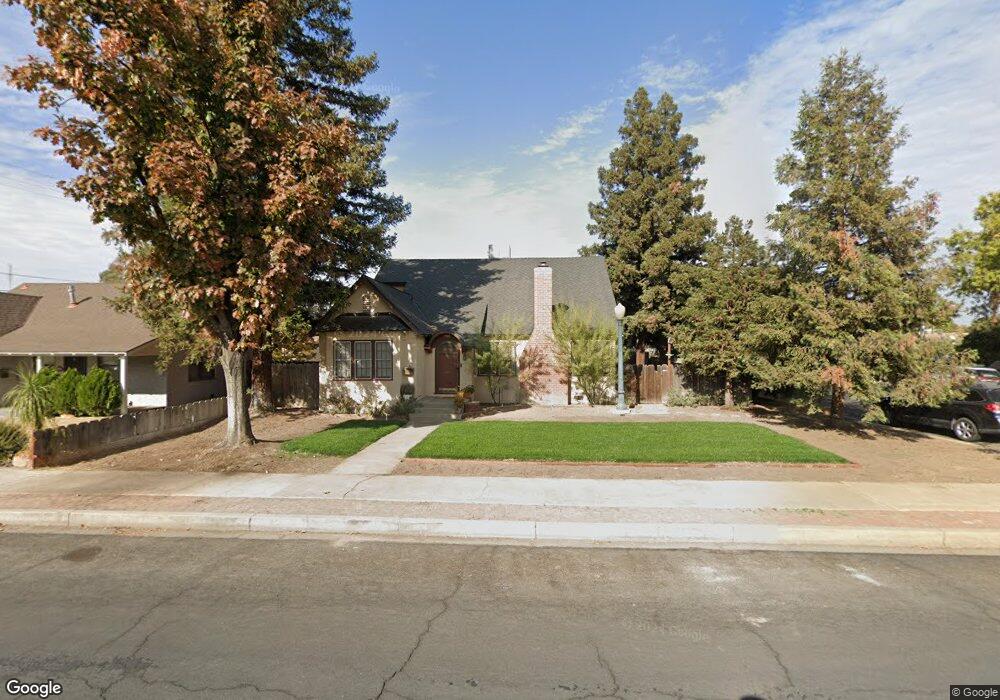
1100 W Kaweah Ave Unit 1 Visalia, CA 93277
South Visalia NeighborhoodEstimated Value: $420,879 - $556,000
3
Beds
3
Baths
2,292
Sq Ft
$212/Sq Ft
Est. Value
About This Home
This home is located at 1100 W Kaweah Ave Unit 1, Visalia, CA 93277 and is currently estimated at $485,970, approximately $212 per square foot. 1100 W Kaweah Ave Unit 1 is a home located in Tulare County with nearby schools including Divisadero Middle School, Mt. Whitney High School, and Crescent Valley II Public Charter School.
Ownership History
Date
Name
Owned For
Owner Type
Purchase Details
Closed on
May 18, 2018
Sold by
Hart William C and Hart Shannon Denair
Bought by
Thiesen Timothy and Thiesen Jennifer
Current Estimated Value
Home Financials for this Owner
Home Financials are based on the most recent Mortgage that was taken out on this home.
Original Mortgage
$256,000
Outstanding Balance
$220,424
Interest Rate
4.4%
Mortgage Type
New Conventional
Estimated Equity
$265,546
Purchase Details
Closed on
Mar 2, 2015
Sold by
Neumann David W
Bought by
Hart William C and Walker Shannon Denair
Home Financials for this Owner
Home Financials are based on the most recent Mortgage that was taken out on this home.
Original Mortgage
$229,270
Interest Rate
3.75%
Mortgage Type
FHA
Purchase Details
Closed on
Aug 4, 1997
Sold by
Sansom Loren R
Bought by
Neumann David W and Neumann Janet L
Home Financials for this Owner
Home Financials are based on the most recent Mortgage that was taken out on this home.
Original Mortgage
$80,000
Interest Rate
7.43%
Create a Home Valuation Report for This Property
The Home Valuation Report is an in-depth analysis detailing your home's value as well as a comparison with similar homes in the area
Home Values in the Area
Average Home Value in this Area
Purchase History
| Date | Buyer | Sale Price | Title Company |
|---|---|---|---|
| Thiesen Timothy | $320,000 | First American Title Co | |
| Hart William C | $233,500 | Chicago Title Company | |
| Neumann David W | $150,000 | First American Title Ins Co |
Source: Public Records
Mortgage History
| Date | Status | Borrower | Loan Amount |
|---|---|---|---|
| Open | Thiesen Timothy | $256,000 | |
| Previous Owner | Hart William C | $229,270 | |
| Previous Owner | Neumann David W | $80,000 |
Source: Public Records
Tax History Compared to Growth
Tax History
| Year | Tax Paid | Tax Assessment Tax Assessment Total Assessment is a certain percentage of the fair market value that is determined by local assessors to be the total taxable value of land and additions on the property. | Land | Improvement |
|---|---|---|---|---|
| 2025 | $3,833 | $364,101 | $56,890 | $307,211 |
| 2024 | $3,833 | $356,963 | $55,775 | $301,188 |
| 2023 | $3,728 | $349,965 | $54,682 | $295,283 |
| 2022 | $3,561 | $343,104 | $53,610 | $289,494 |
| 2021 | $3,566 | $336,377 | $52,559 | $283,818 |
| 2020 | $3,545 | $332,928 | $52,020 | $280,908 |
| 2019 | $3,434 | $326,400 | $51,000 | $275,400 |
| 2018 | $2,587 | $246,639 | $61,264 | $185,375 |
| 2017 | $2,556 | $241,803 | $60,063 | $181,740 |
| 2016 | $2,513 | $237,061 | $58,885 | $178,176 |
| 2015 | $2,009 | $199,292 | $46,502 | $152,790 |
| 2014 | $2,009 | $195,388 | $45,591 | $149,797 |
Source: Public Records
Map
Nearby Homes
- 602 S Conyer St
- 1301 W Beverly Dr
- 1107 W Westcott Ave
- 526 W Myrtle Ave
- 621 S Divisadero St
- 1321 W Oak Ave
- 1315 S Conyer St
- 1421 W Oak Ave
- 313 N Giddings St
- 433 S Church St
- 733 W Paradise Ave
- 542 W Paradise Ave
- 1406 W Princeton Ave
- 422 W Race Ave
- 439 S Bridge St Unit 5
- 704 N Divisadero St
- 1640 W Princeton Ct
- 714 W Cambridge Ave
- 523 N Locust St
- 737 N Willis St
- 1100 W Kaweah Ave
- 1106 W Kaweah Ave
- 509 S Sowell St Unit A
- 1020 W Kaweah Ave
- 1108 W Kaweah Ave
- 1101 W Kaweah Ave
- 1101 W Noble Ave
- 1105 W Noble Ave
- 1016 W Kaweah Ave
- 607 S Sowell St
- 520 S Oak Park St
- 1019 W Noble Ave
- 1107 W Kaweah Ave
- 502 S Oak Park St
- 1011 W Kaweah Ave
- 1013 W Noble Ave
- 611 S Sowell St
- 500 S Oak Park St
- 1009 W Kaweah Ave
- 600 S Oak Park St