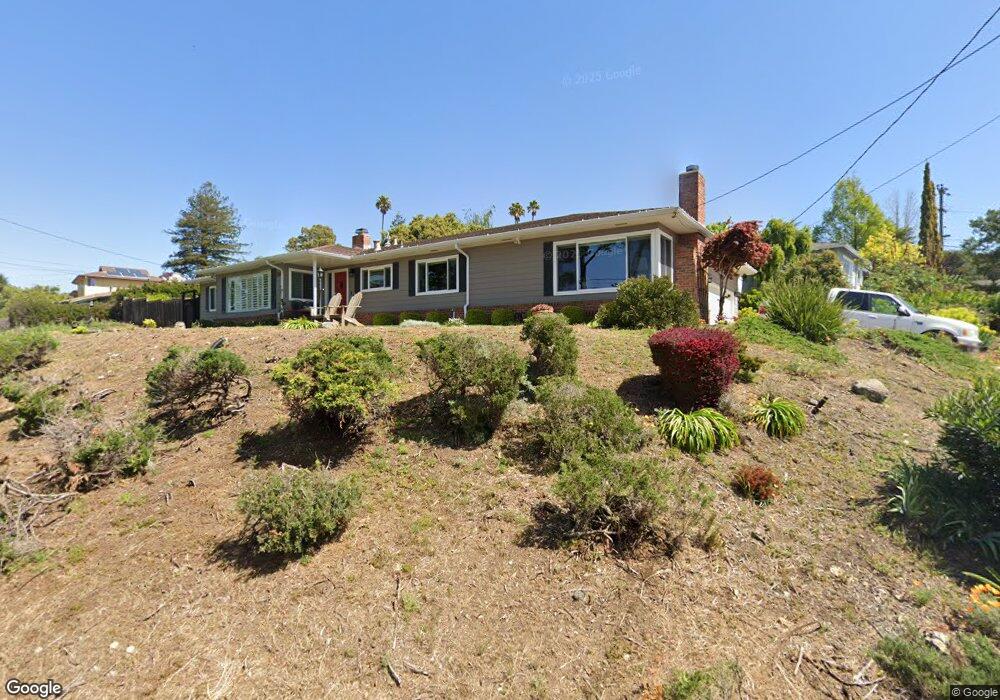
11000 Overmoor St Oakland, CA 94605
Chabot Park NeighborhoodEstimated Value: $1,013,000 - $1,135,503
3
Beds
2
Baths
2,310
Sq Ft
$464/Sq Ft
Est. Value
About This Home
This home is located at 11000 Overmoor St, Oakland, CA 94605 and is currently estimated at $1,072,876, approximately $464 per square foot. 11000 Overmoor St is a home located in Alameda County with nearby schools including Grass Valley Elementary School, Elmhurst United Middle School, and Skyline High School.
Ownership History
Date
Name
Owned For
Owner Type
Purchase Details
Closed on
Feb 1, 2021
Sold by
Stewart Gregory and Stewart Olivia M
Bought by
Stewart Gregory L and Stewart Olivia M
Current Estimated Value
Purchase Details
Closed on
Jul 9, 2001
Sold by
Koojoolian Evelyn G
Bought by
Stewart Gregory and Stewart Olivia M
Home Financials for this Owner
Home Financials are based on the most recent Mortgage that was taken out on this home.
Original Mortgage
$425,000
Outstanding Balance
$182,791
Interest Rate
8.75%
Estimated Equity
$890,085
Purchase Details
Closed on
Dec 18, 1997
Sold by
Koojoolian Avery
Bought by
Koojoolian Avery and Koojoolian Evelyn G
Home Financials for this Owner
Home Financials are based on the most recent Mortgage that was taken out on this home.
Original Mortgage
$64,500
Interest Rate
7.16%
Create a Home Valuation Report for This Property
The Home Valuation Report is an in-depth analysis detailing your home's value as well as a comparison with similar homes in the area
Home Values in the Area
Average Home Value in this Area
Purchase History
| Date | Buyer | Sale Price | Title Company |
|---|---|---|---|
| Stewart Gregory L | -- | None Available | |
| Stewart Gregory | $473,000 | Fidelity National Title Co | |
| Koojoolian Avery | -- | -- |
Source: Public Records
Mortgage History
| Date | Status | Borrower | Loan Amount |
|---|---|---|---|
| Open | Stewart Gregory | $425,000 | |
| Previous Owner | Koojoolian Avery | $64,500 |
Source: Public Records
Tax History Compared to Growth
Tax History
| Year | Tax Paid | Tax Assessment Tax Assessment Total Assessment is a certain percentage of the fair market value that is determined by local assessors to be the total taxable value of land and additions on the property. | Land | Improvement |
|---|---|---|---|---|
| 2025 | $10,770 | $691,567 | $209,614 | $488,953 |
| 2024 | $10,770 | $677,872 | $205,505 | $479,367 |
| 2023 | $11,264 | $671,446 | $201,476 | $469,970 |
| 2022 | $10,958 | $651,281 | $197,526 | $460,755 |
| 2021 | $10,497 | $638,375 | $193,653 | $451,722 |
| 2020 | $10,374 | $638,759 | $191,668 | $447,091 |
| 2019 | $9,995 | $626,237 | $187,911 | $438,326 |
| 2018 | $9,773 | $613,960 | $184,227 | $429,733 |
| 2017 | $9,402 | $601,925 | $180,615 | $421,310 |
| 2016 | $9,099 | $590,126 | $177,075 | $413,051 |
| 2015 | $9,041 | $581,264 | $174,416 | $406,848 |
| 2014 | $8,938 | $569,881 | $171,000 | $398,881 |
Source: Public Records
Map
Nearby Homes
- 11201 Lochard St
- 11320 Lochard St
- 9 Leamont Ct
- 0 Lochard St Unit 41113902
- 11275 Kerrigan Dr
- 25 Woodcliff Ct
- 11388 Lochard St
- 10838 Monan St
- 10910 Glen Artney St
- 10353 Royal Oak Rd
- 10317 Royal Oak Rd
- 4847 Dunkirk Ave
- 10768 Sheldon St
- 10492 Royal Oak Rd
- 3910 Oak Hill Rd
- 10601 Sheldon St
- 142 Sequoyah View Dr
- 10923 Foothill Blvd
- 162 Covington St
- 3247 Revere Ave
- 11040 Overmoor St
- 11023 Cameron Ave
- 10880 Snowdown Ave
- 11001 Overmoor St
- 11011 Cameron Ave
- 11041 Overmoor St
- 10885 Snowdown Ave
- 11050 Cameron Ave
- 11022 Cameron Ave
- 10881 Snowdown Ave
- 0 Overmoor St
- 10870 Snowdown Ave
- 11065 Overmoor St
- 10951 Cameron Ave
- 11000 Cameron Ave
- 10875 Snowdown Ave
- 3850 Malcolm Ave
- 3840 Malcolm Ave
- 11060 Overmoor St
- 11001 Cliffland Ave