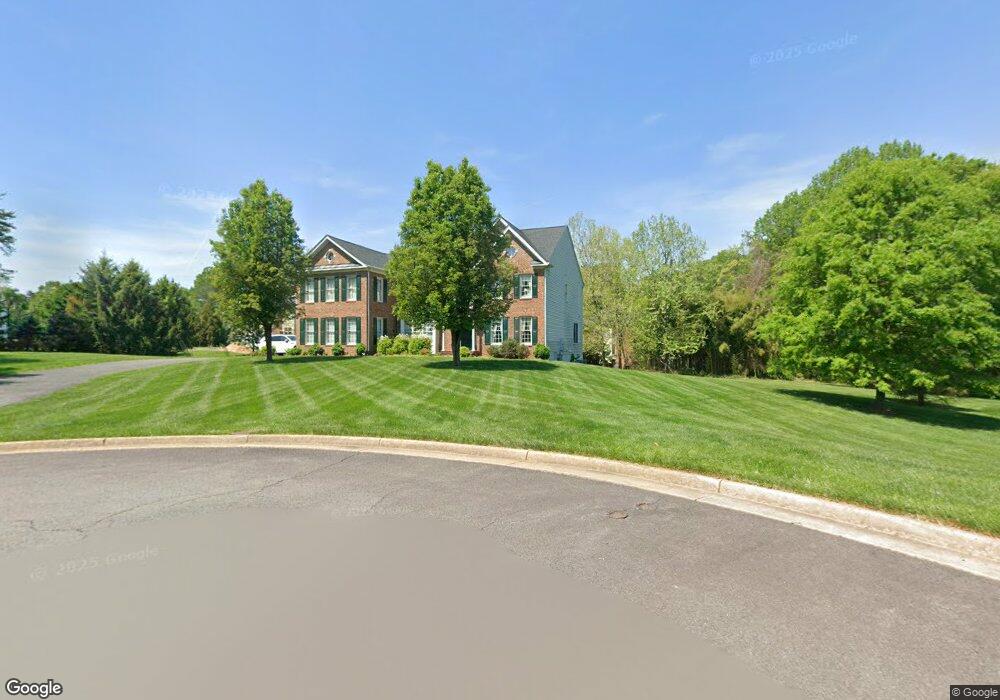
11003 E Oaks Ct Oakton, VA 22124
Estimated Value: $1,608,000 - $1,964,000
5
Beds
5
Baths
4,638
Sq Ft
$375/Sq Ft
Est. Value
About This Home
This home is located at 11003 E Oaks Ct, Oakton, VA 22124 and is currently estimated at $1,738,111, approximately $374 per square foot. 11003 E Oaks Ct is a home located in Fairfax County with nearby schools including Waples Mill Elementary School, Franklin Middle, and Flint Hill School.
Ownership History
Date
Name
Owned For
Owner Type
Purchase Details
Closed on
Apr 6, 2006
Sold by
Ajmera Ajay B
Bought by
Morgner Evelyn C
Current Estimated Value
Home Financials for this Owner
Home Financials are based on the most recent Mortgage that was taken out on this home.
Original Mortgage
$999,999
Outstanding Balance
$571,342
Interest Rate
6.26%
Mortgage Type
New Conventional
Estimated Equity
$1,166,769
Purchase Details
Closed on
Feb 24, 2000
Sold by
Oakton Crest L C
Bought by
Ajmera Ajay B
Home Financials for this Owner
Home Financials are based on the most recent Mortgage that was taken out on this home.
Original Mortgage
$511,200
Interest Rate
8.15%
Purchase Details
Closed on
Oct 13, 1999
Sold by
West Oaks L C
Bought by
Oakton Crest L C
Home Financials for this Owner
Home Financials are based on the most recent Mortgage that was taken out on this home.
Original Mortgage
$2,400,000
Interest Rate
7.8%
Create a Home Valuation Report for This Property
The Home Valuation Report is an in-depth analysis detailing your home's value as well as a comparison with similar homes in the area
Home Values in the Area
Average Home Value in this Area
Purchase History
| Date | Buyer | Sale Price | Title Company |
|---|---|---|---|
| Morgner Evelyn C | $1,335,000 | -- | |
| Ajmera Ajay B | $639,930 | -- | |
| Oakton Crest L C | $219,321 | -- |
Source: Public Records
Mortgage History
| Date | Status | Borrower | Loan Amount |
|---|---|---|---|
| Open | Morgner Evelyn C | $999,999 | |
| Previous Owner | Ajmera Ajay B | $511,200 | |
| Previous Owner | Oakton Crest L C | $2,400,000 |
Source: Public Records
Tax History Compared to Growth
Tax History
| Year | Tax Paid | Tax Assessment Tax Assessment Total Assessment is a certain percentage of the fair market value that is determined by local assessors to be the total taxable value of land and additions on the property. | Land | Improvement |
|---|---|---|---|---|
| 2025 | $16,441 | $1,503,140 | $644,000 | $859,140 |
| 2024 | $16,441 | $1,419,170 | $614,000 | $805,170 |
| 2023 | $16,015 | $1,419,170 | $614,000 | $805,170 |
| 2022 | $16,228 | $1,419,170 | $614,000 | $805,170 |
| 2021 | $15,302 | $1,304,000 | $564,000 | $740,000 |
| 2020 | $14,065 | $1,188,440 | $524,000 | $664,440 |
| 2019 | $13,448 | $1,136,300 | $524,000 | $612,300 |
| 2018 | $13,438 | $1,168,530 | $524,000 | $644,530 |
| 2017 | $13,567 | $1,168,530 | $524,000 | $644,530 |
| 2016 | $13,537 | $1,168,530 | $524,000 | $644,530 |
| 2015 | $12,751 | $1,142,540 | $509,000 | $633,540 |
| 2014 | $13,253 | $1,190,230 | $509,000 | $681,230 |
Source: Public Records
Map
Nearby Homes
- 3424 Jermantown Rd
- 10714 Dudley Ct
- 3193 Ariana Dr
- 10820 Estate Ct
- 10900 Orchard St
- 11410 Waples Mill Rd
- 3410 Burrows Ave
- 3010 Westhurst Ct
- 10602 Oak Place
- 10918 Warwick Ave
- 11319 Aristotle Dr Unit 3-106
- 10401 White Granite Dr Unit 2
- 10401 White Granite Dr Unit 1
- Camden Plan at Magnolia Oaks
- Avery Plan at Magnolia Oaks
- 10906 Miller Rd
- 10833 Warwick Ave
- 11355 Aristotle Dr Unit 8-313
- 3006 Weber Place
- 11008 Devenish Dr