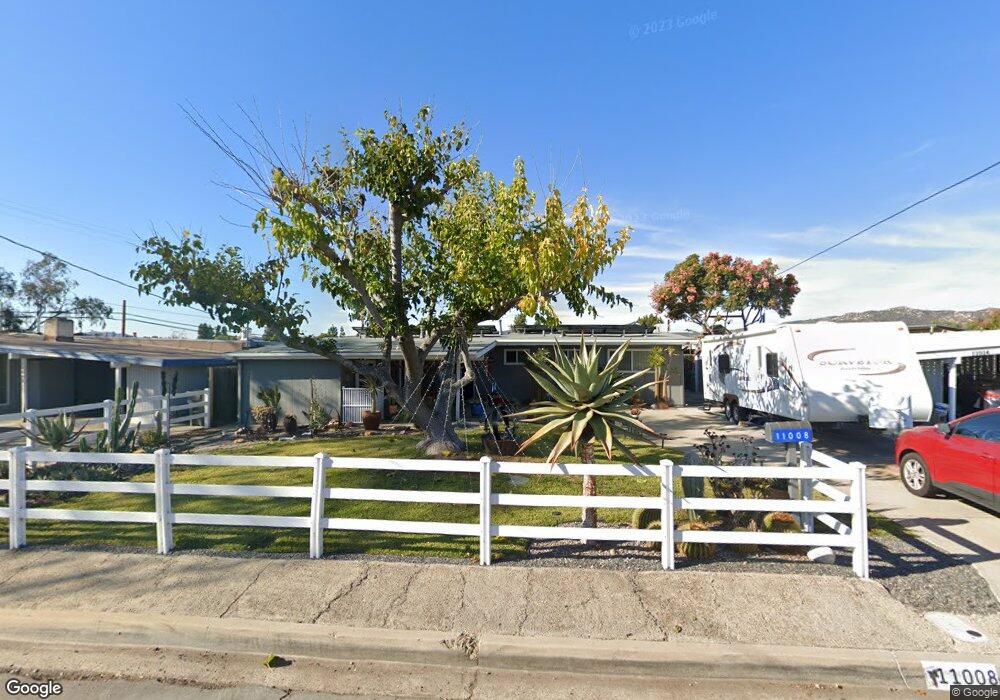
11008 Meadow Terrace Dr Santee, CA 92071
Estimated Value: $709,000 - $921,000
3
Beds
2
Baths
1,227
Sq Ft
$640/Sq Ft
Est. Value
About This Home
This home is located at 11008 Meadow Terrace Dr, Santee, CA 92071 and is currently estimated at $785,862, approximately $640 per square foot. 11008 Meadow Terrace Dr is a home located in San Diego County with nearby schools including Pepper Drive Elementary School, Santana High School, and River Valley Charter School.
Ownership History
Date
Name
Owned For
Owner Type
Purchase Details
Closed on
Feb 24, 2003
Sold by
Feraldi Tracy and Feraldi Joseph
Bought by
Cox Robert D and Sorenson Ingrid E
Current Estimated Value
Home Financials for this Owner
Home Financials are based on the most recent Mortgage that was taken out on this home.
Original Mortgage
$278,100
Outstanding Balance
$119,118
Interest Rate
5.83%
Estimated Equity
$666,744
Purchase Details
Closed on
May 18, 1996
Sold by
Purdy Mark and Purdy Martine
Bought by
Feraldi Joseph and Feraldi Tracy
Purchase Details
Closed on
May 11, 1996
Sold by
Purdy Mark and Purdy Martine
Bought by
Feraldt Joseph and Feraldt Tracy
Purchase Details
Closed on
Jun 22, 1993
Sold by
Calder Harold D and Calder Lola M
Bought by
Purdy Mark and Purdy Martine
Home Financials for this Owner
Home Financials are based on the most recent Mortgage that was taken out on this home.
Original Mortgage
$134,662
Interest Rate
7.2%
Mortgage Type
VA
Create a Home Valuation Report for This Property
The Home Valuation Report is an in-depth analysis detailing your home's value as well as a comparison with similar homes in the area
Home Values in the Area
Average Home Value in this Area
Purchase History
| Date | Buyer | Sale Price | Title Company |
|---|---|---|---|
| Cox Robert D | $270,000 | Equity Title Company | |
| Feraldi Joseph | -- | -- | |
| Feraldt Joseph | -- | -- | |
| Purdy Mark | $133,000 | Chicago Title Co |
Source: Public Records
Mortgage History
| Date | Status | Borrower | Loan Amount |
|---|---|---|---|
| Open | Cox Robert D | $278,100 | |
| Previous Owner | Purdy Mark | $134,662 |
Source: Public Records
Tax History Compared to Growth
Tax History
| Year | Tax Paid | Tax Assessment Tax Assessment Total Assessment is a certain percentage of the fair market value that is determined by local assessors to be the total taxable value of land and additions on the property. | Land | Improvement |
|---|---|---|---|---|
| 2025 | $4,744 | $402,619 | $231,725 | $170,894 |
| 2024 | $4,744 | $394,726 | $227,182 | $167,544 |
| 2023 | $4,598 | $386,987 | $222,728 | $164,259 |
| 2022 | $4,562 | $379,400 | $218,361 | $161,039 |
| 2021 | $4,498 | $371,962 | $214,080 | $157,882 |
| 2020 | $4,442 | $368,149 | $211,885 | $156,264 |
| 2019 | $4,285 | $360,931 | $207,731 | $153,200 |
| 2018 | $4,196 | $353,855 | $203,658 | $150,197 |
| 2017 | $4,140 | $346,917 | $199,665 | $147,252 |
| 2016 | $4,014 | $340,115 | $195,750 | $144,365 |
| 2015 | $3,784 | $320,000 | $166,000 | $154,000 |
| 2014 | $3,547 | $300,000 | $156,000 | $144,000 |
Source: Public Records
Map
Nearby Homes
- 10969 Crystal Springs Rd
- 11007 Larkridge St
- 11061 Crystal Springs Rd
- 3042 Cole Grade Dr
- 1050 Iron Wheel St
- 9126 Heatherdale St
- 1605 Calabria St
- 1705 Montilla St
- 10791 Jeanne Terrace Unit A
- 9255 N Magnolia Ave Unit 333
- 9255 N Magnolia Ave Unit 350
- 9255 N Magnolia Ave Unit SPC 356
- 9255 N Magnolia Ave Unit 46
- 1110 Calabria St Unit 10
- 10727 Holly Meadows Dr Unit A
- 10664 Sandy Creek Dr
- 8731 Graves Ave Unit 42
- 8933 Diamondback Dr
- 8712 N Magnolia Ave Unit 289
- 8712 N Magnolia Ave Unit 169
- 11014 Meadow Terrace Dr
- 11002 Meadow Terrace Dr
- 11020 Meadow Terrace Dr
- 9255 Shadow Hill Rd
- 11026 Meadow Terrace Dr
- 9256 Bird St
- 9310 Shadow Hill Rd
- 9304 Shadow Hill Rd
- 9249 Shadow Hill Rd
- 9263 Bird St
- 11032 Meadow Terrace Dr
- 9260 Shadow Hill Rd
- 9250 Bird St
- 9257 Bird St
- 9254 Shadow Hill Rd
- 9243 Shadow Hill Rd
- 11038 Meadow Terrace Dr
- 11041 Meadow Terrace Dr
- 9244 Bird St
- 9251 Bird St