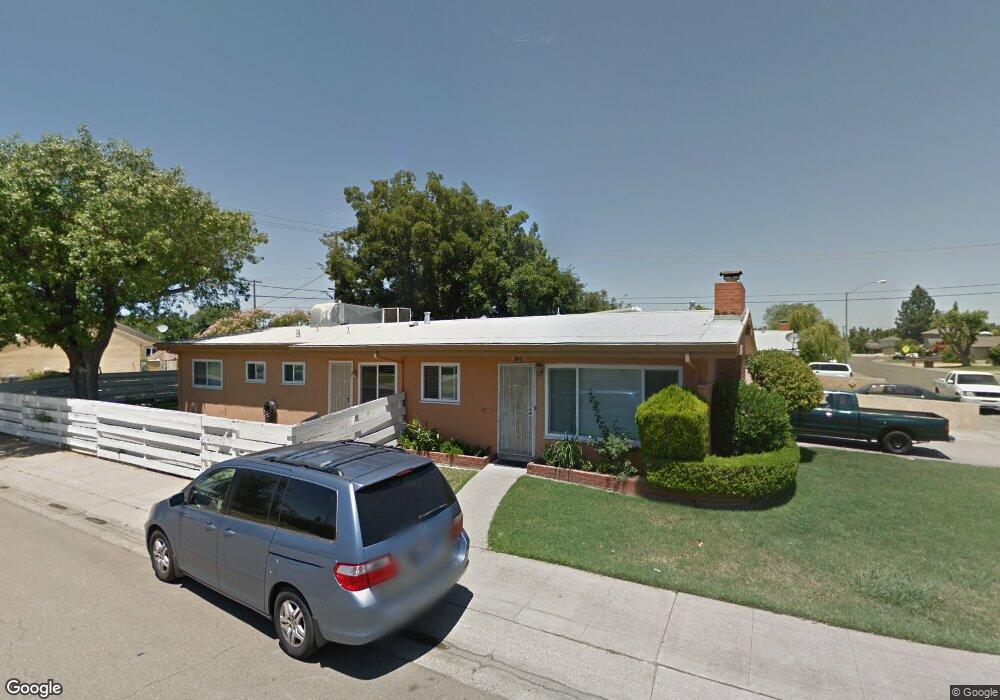
1101 Graffigna Ave Lodi, CA 95240
North Lodi NeighborhoodEstimated Value: $392,000 - $464,000
4
Beds
2
Baths
1,227
Sq Ft
$349/Sq Ft
Est. Value
About This Home
This home is located at 1101 Graffigna Ave, Lodi, CA 95240 and is currently estimated at $427,657, approximately $348 per square foot. 1101 Graffigna Ave is a home located in San Joaquin County with nearby schools including George Washington Elementary School, Millswood Middle School, and Lodi High School.
Ownership History
Date
Name
Owned For
Owner Type
Purchase Details
Closed on
Nov 11, 2008
Sold by
Lasalle Bank National Association
Bought by
Cha Ma and Vang Soua
Current Estimated Value
Home Financials for this Owner
Home Financials are based on the most recent Mortgage that was taken out on this home.
Original Mortgage
$152,981
Outstanding Balance
$102,336
Interest Rate
6.47%
Mortgage Type
FHA
Estimated Equity
$325,321
Purchase Details
Closed on
Sep 9, 2008
Sold by
Angel Jose
Bought by
Lasalle Bank Na and Mlmi Trust Series 2006-Rm1
Purchase Details
Closed on
Dec 19, 2005
Sold by
Angel Lorena Rosales
Bought by
Angel Jose
Home Financials for this Owner
Home Financials are based on the most recent Mortgage that was taken out on this home.
Original Mortgage
$67,800
Interest Rate
6.35%
Mortgage Type
Stand Alone Second
Purchase Details
Closed on
Dec 12, 2005
Sold by
The Betty J Tweten Living Trust and Tweten Betty J
Bought by
Angel Jose
Home Financials for this Owner
Home Financials are based on the most recent Mortgage that was taken out on this home.
Original Mortgage
$67,800
Interest Rate
6.35%
Mortgage Type
Stand Alone Second
Create a Home Valuation Report for This Property
The Home Valuation Report is an in-depth analysis detailing your home's value as well as a comparison with similar homes in the area
Home Values in the Area
Average Home Value in this Area
Purchase History
| Date | Buyer | Sale Price | Title Company |
|---|---|---|---|
| Cha Ma | $155,000 | Fidelity National Title Co | |
| Lasalle Bank Na | $127,462 | None Available | |
| Angel Jose | -- | Fidelity Natl Title Ins Co | |
| Angel Jose | $339,000 | Fidelity Natl Title Ins Co |
Source: Public Records
Mortgage History
| Date | Status | Borrower | Loan Amount |
|---|---|---|---|
| Open | Cha Ma | $152,981 | |
| Previous Owner | Angel Jose | $67,800 | |
| Previous Owner | Angel Jose | $271,200 |
Source: Public Records
Tax History
| Year | Tax Paid | Tax Assessment Tax Assessment Total Assessment is a certain percentage of the fair market value that is determined by local assessors to be the total taxable value of land and additions on the property. | Land | Improvement |
|---|---|---|---|---|
| 2025 | $2,173 | $199,590 | $59,232 | $140,358 |
| 2024 | $2,114 | $195,677 | $58,071 | $137,606 |
| 2023 | $2,090 | $191,841 | $56,933 | $134,908 |
| 2022 | $2,043 | $188,080 | $55,817 | $132,263 |
| 2021 | $2,080 | $184,393 | $54,723 | $129,670 |
| 2020 | $2,026 | $182,503 | $54,162 | $128,341 |
| 2019 | $1,985 | $178,925 | $53,100 | $125,825 |
| 2018 | $1,958 | $175,417 | $52,059 | $123,358 |
| 2017 | $1,914 | $171,979 | $51,039 | $120,940 |
| 2016 | $1,795 | $168,607 | $50,038 | $118,569 |
| 2014 | $1,753 | $162,824 | $48,322 | $114,502 |
Source: Public Records
Map
Nearby Homes
- 507 N Sunset Dr
- 1416 Reiman St
- 1413 Mariposa Way
- 1424 Graffigna Ave
- 1427 Reiman St
- 527 Cross St
- 1501 Mariposa Way
- 1507 Holly Dr
- 525 Eureka Ave
- 606 W Turner Rd
- 333 W Locust St
- 909 Greenwood Dr
- 2019 Debbie Ln
- 1180 Northwood Dr
- 518 N Church St
- 101 W Lockeford St
- 705 N School St
- 2127 Oxford Way
- 1786 Le Bec Ct
- 1729 Le Bec Ct
- 407 N Fairmont Ave
- 1115 Graffigna Ave
- 1100 Graffigna Ave
- 413 N Fairmont Ave
- 1110 Graffigna Ave
- 412 N Sunset Dr
- 313 N Fairmont Ave
- 406 N Fairmont Ave
- 318 N Fairmont Ave
- 419 N Fairmont Ave
- 1116 Graffigna Ave
- 412 N Fairmont Ave
- 312 N Fairmont Ave
- 418 N Sunset Dr
- 307 N Fairmont Ave
- 1122 Graffigna Ave
- 418 N Fairmont Ave
- 425 N Fairmont Ave
- 424 N Sunset Dr
- 1111 W Lockeford St
Your Personal Tour Guide
Ask me questions while you tour the home.