Estimated Value: $224,893 - $304,000
--
Bed
--
Bath
1,212
Sq Ft
$205/Sq Ft
Est. Value
About This Home
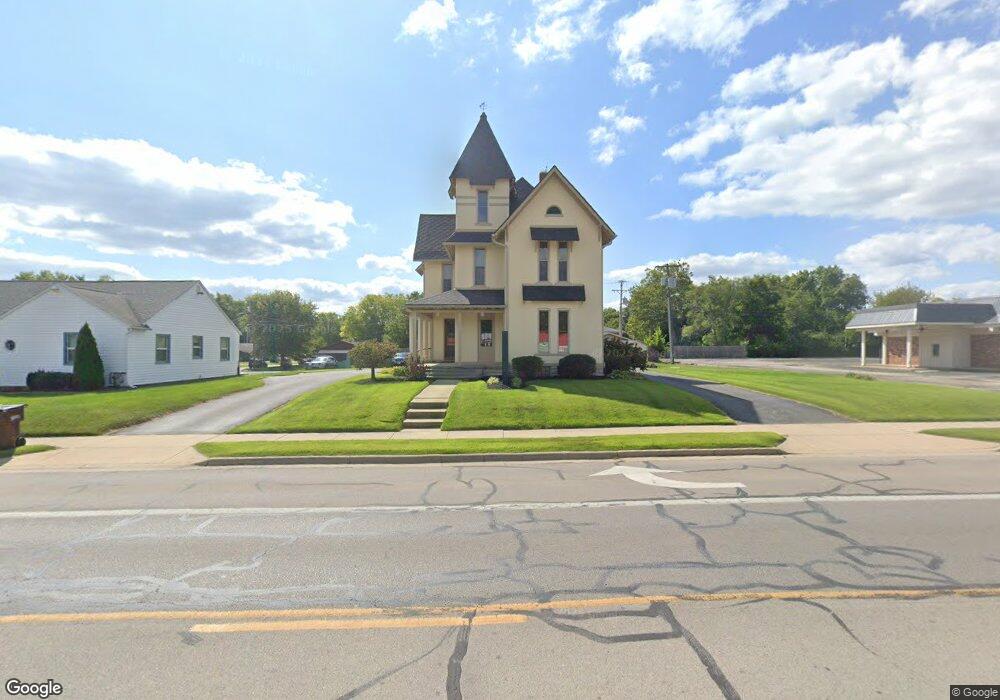
This home is located at 1101 N Barron St Unit 1103, Eaton, OH 45320 and is currently estimated at $248,223, approximately $204 per square foot. 1101 N Barron St Unit 1103 is a home located in Preble County with nearby schools including Hollingsworth East Elementary School, William Bruce Elementary School, and Eaton Middle School.
Ownership History
Date
Name
Owned For
Owner Type
Purchase Details
Closed on
Jun 8, 2009
Sold by
Lee Miriam L and Lee John D
Bought by
Lee Miriam L and The Revocable Living Trust Of Miriam L L
Current Estimated Value
Purchase Details
Closed on
Feb 21, 2002
Sold by
Lee Donna
Bought by
Lee Miriam L
Home Financials for this Owner
Home Financials are based on the most recent Mortgage that was taken out on this home.
Original Mortgage
$127,027
Outstanding Balance
$52,821
Interest Rate
7.14%
Mortgage Type
Commercial
Estimated Equity
$195,402
Purchase Details
Closed on
Mar 31, 1998
Sold by
Koehl Timothy J
Bought by
Lee S Richard Donna S
Purchase Details
Closed on
Sep 29, 1992
Bought by
Darr Todd M and Darr Michelle D
Purchase Details
Closed on
Jan 25, 1985
Bought by
Darr Todd M and Darr Michelle D
Create a Home Valuation Report for This Property
The Home Valuation Report is an in-depth analysis detailing your home's value as well as a comparison with similar homes in the area
Home Values in the Area
Average Home Value in this Area
Purchase History
| Date | Buyer | Sale Price | Title Company |
|---|---|---|---|
| Lee Miriam L | -- | Attorney | |
| Lee Miriam L | $160,000 | -- | |
| Lee S Richard Donna S | $150,000 | -- | |
| Darr Todd M | $45,000 | -- | |
| Darr Todd M | $41,500 | -- |
Source: Public Records
Mortgage History
| Date | Status | Borrower | Loan Amount |
|---|---|---|---|
| Open | Lee Miriam L | $127,027 |
Source: Public Records
Tax History Compared to Growth
Tax History
| Year | Tax Paid | Tax Assessment Tax Assessment Total Assessment is a certain percentage of the fair market value that is determined by local assessors to be the total taxable value of land and additions on the property. | Land | Improvement |
|---|---|---|---|---|
| 2024 | $3,308 | $80,460 | $50,430 | $30,030 |
| 2023 | $3,308 | $80,460 | $50,430 | $30,030 |
| 2022 | $3,271 | $66,600 | $45,840 | $20,760 |
| 2021 | $3,476 | $66,600 | $45,840 | $20,760 |
| 2020 | $3,295 | $66,600 | $45,840 | $20,760 |
| 2019 | $3,296 | $66,600 | $45,840 | $20,760 |
| 2018 | $3,455 | $66,600 | $45,840 | $20,760 |
| 2017 | $4,036 | $80,460 | $45,840 | $34,620 |
| 2016 | $2,430 | $48,330 | $27,640 | $20,690 |
| 2014 | $2,403 | $48,330 | $27,640 | $20,690 |
| 2013 | $2,452 | $48,328 | $27,643 | $20,685 |
Source: Public Records
Map
Nearby Homes
- 105 Leatherman Place
- 919 N Barron St
- 1119 N Maple St
- 210 W Spring St
- 230 W Spring St
- 1008 N Maple St
- 331 W Chicago St
- 1302 Aukerman St
- 612 N Cherry St
- 217 Miller Ave
- 124 Deem St
- 422 Lexington Ave
- 236 Eaton Ave
- 401 Romadoor Ave Unit 511 (BLDG 12)
- 0-00 Washington Jackson Rd
- 3525 U S 127
- 405 Walnut St
- 414 N Maple St
- 111 W High St
- 125 Arlington Dr
- 1021 N Barron St
- 1107 N Barron St
- 112 Debbie Dr
- 1017 N Barron St
- 1110 N Barron St
- 1100 N Barron St
- 1024 N Barron St
- 1116 N Barron St
- 116 Debbie Dr
- 1015 N Barron St
- 111 Debbie Dr
- 1009 N Barron St
- 102 Leatherman Place
- 120 Debbie Dr
- 115 Debbie Dr Unit 117
- 101 Leatherman Place
- 1007 N Barron St
- 104 Leatherman Place
- 119 Debbie Dr Unit 121
- 1008 N Barron St